Choropleths in R
July 31, 2010
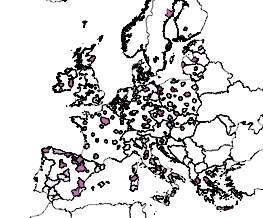
The other day I run into the need of creating choropleths, which are thematic maps where attribute data are displayed using a color scale and look like this:
It is a very simple task, provided you have the geo-referenced data, and many packages (such as qGIS) make it a click away. However, I had to create around 300 choropleths and computers were not made for us to click 300 times to perform the same task over and over...
R is a fantastic free software that provides a very powerful graphical support and also has a lot of great packages other people have contributed, so first I assumed it'd be almost built in. I'm sure it is somewhere, but after 2mins. of googling I realized I'd enjoy more spending time coding it myself (something it looked like a 5-minutes thing) than looking it up on the web, and so I did. After many series of "5 minutes", I did it (and it works). I wasn't really thinking of posting it as it is a very simple function but after some of the pain (and fun) I went trhough to code it, I figured if it saved somebody else time, it'd have been a better invested time.
Big thanks to David Folch for initial idea and support as well as the original source cited below.
Feel free to post any comments or feedback if you've used the function. Thanks in advance.
Sources
Usage
It is a very simple function that assumes you have a shapefile and the attribute data you want to plot are appended to the .dbf that comes with the shapefile. If that is the case, simply pass in the arguments like this:
[sourcecode language="c"]
map <- choropleth(shp, field, png=FALSE, bins=FALSE, bgLayer=FALSE, colPal="Blues", style="hclust", lwd=0.5, title='', sub='', xlab='', ylab='', legend=TRUE)
[/sourcecode]
Simply copy the source code posted below to a file and source it to be able to use the function:
[sourcecode language="c"]
source('/path/to/file.r')
[/sourcecode]
Arguments
- shp: shapefile path.
- field: field in the dbf you want to plot (string as it is in the dbf, case sensitive).
- png: if FALSE causes to plot the map on R's graphical device; otherwise, specify a path to the png file where the map is printed to. Set to FALSE by default.
- bins: number of different colours you want in your plot. If FALSE, it assigns one per each different value (handy for categorical data). Set to FALSE by default.
- bgLayer: path to the shapefile to be put as a background in the map (say border lines). Set to FALSE by default.
- colPal: colour palette, use it as in R's RColorBrewer.
- style: function to be used for binning. Use it as in 'classIntervals' of classInt package. Defaults to 'hclust'.
- lwd: line width. Defaults to 0.5.
- title: optional string with title.
- sub: optional string with subtitle.
- xlab: optional string with X axis.
- ylab: optional string with Y axis
- legend: boolean, if TRUE (default) sets the legend.
Dependencies
Source Code
[sourcecode language="c" collapse="false"]
##################################
# Choropleth: thematic maps in R #
##################################
# Author: Daniel Arribas-Bel <daniel.arribas.bel@gmail.com>
# Copyright 2010 by Daniel Arribas-Bel
# This program is free software: you can redistribute it and/or modify
# it under the terms of the GNU General Public License as published by
# the Free Software Foundation, either version 3 of the License, or
# (at your option) any later version.
# This program is distributed in the hope that it will be useful,
# but WITHOUT ANY WARRANTY; without even the implied warranty of
# MERCHANTABILITY or FITNESS FOR A PARTICULAR PURPOSE. See the
# GNU General Public License for more details.
# See: <http://creativecommons.org/licenses/GPL/2.0/> or <http://www.gnu.org/licenses/>
library(maptools)
library(spatial)
library(RColorBrewer)
library(classInt)
choropleth <- function(shp, field, png=FALSE, bins=FALSE, bgLayer=FALSE,
colPal="Blues", style="hclust", lwd=0.5, title='', sub='', xlab='',
ylab='', legend=TRUE){
# If not 'bins' -> categorical data
poly <- readShapeSpatial(shp)
attach(poly@data, warn.conflicts=FALSE)
data <- get(field)
if(bins==FALSE){
bins <- length(unique(get(field)))
colCode <- colCoder(poly, field, colPal)
leyenda <- colCode$legend
fill <- colCode$paleta
colCode <- colCode$colVec
} else {
colors <- brewer.pal(bins, colPal)
class = classIntervals(data, bins, style)
colCode = findColours(class, colors, digits=4)
leyenda = names(attr(colCode, "table"))
fill = attr(colCode, "palette")
}
detach(poly@data)
#
if(png!=FALSE){
png(png, width=960, height=960, bg="transparent")
}
if(bgLayer!=FALSE){
polyBg <- readShapeSpatial(bgLayer)
plot(polyBg, lwd=lwd)
plot(poly, add=TRUE, col=colCode, lwd=lwd)
} else {
plot(poly, col=colCode, lwd=lwd)
}
title(main=title, sub=sub, xlab=xlab, ylab=ylab)
if(legend==TRUE){legend("topleft", legend=leyenda, fill=fill, cex=0.75, bty="n")}
if(png!=FALSE){
dev.off()
}
#"Map created"
colCode
}
colCoder <- function(poly, var, colPal){
attach(poly@data, warn.conflicts=FALSE)
uniques <- unique(get(var))
paleta <- brewer.pal(length(uniques), colPal)
colVec <- mat.or.vec(length(get(var)), 1)
for(row in seq(length(get(var)))){
ind <- which(uniques == get(var)[row])
colVec[row] <- paleta[ind]
}
detach(poly@data)
res <- list(colVec=colVec, legend=uniques, paleta=paleta)
res
}
[/sourcecode]
This software is licensed under the CC-GNU GPL version 2.0 or later.

