Geographic Data Science
Visualization
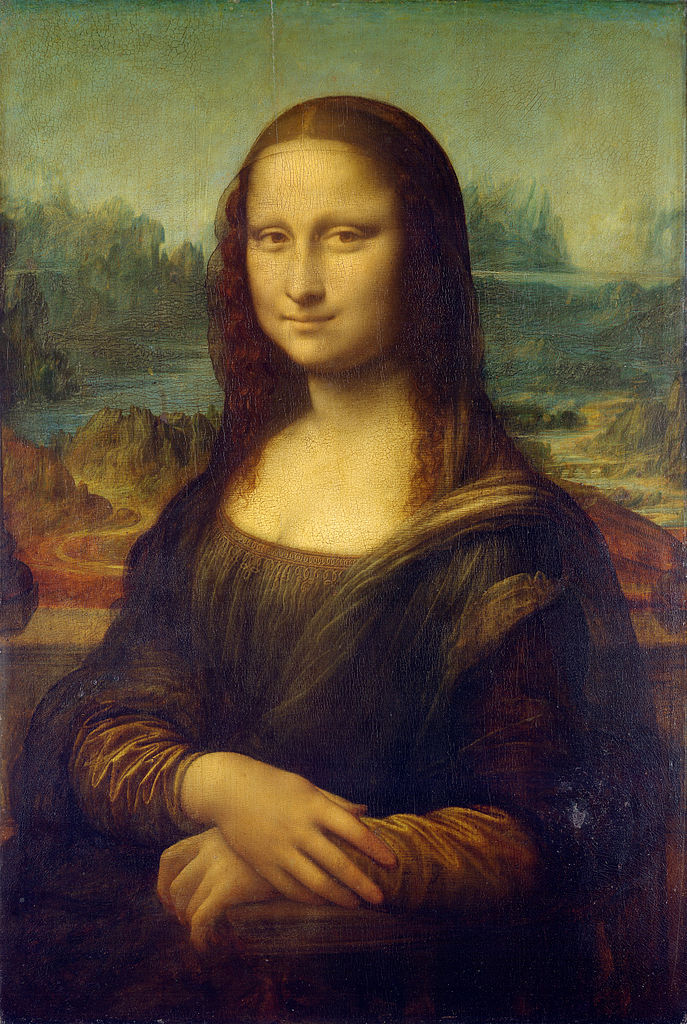
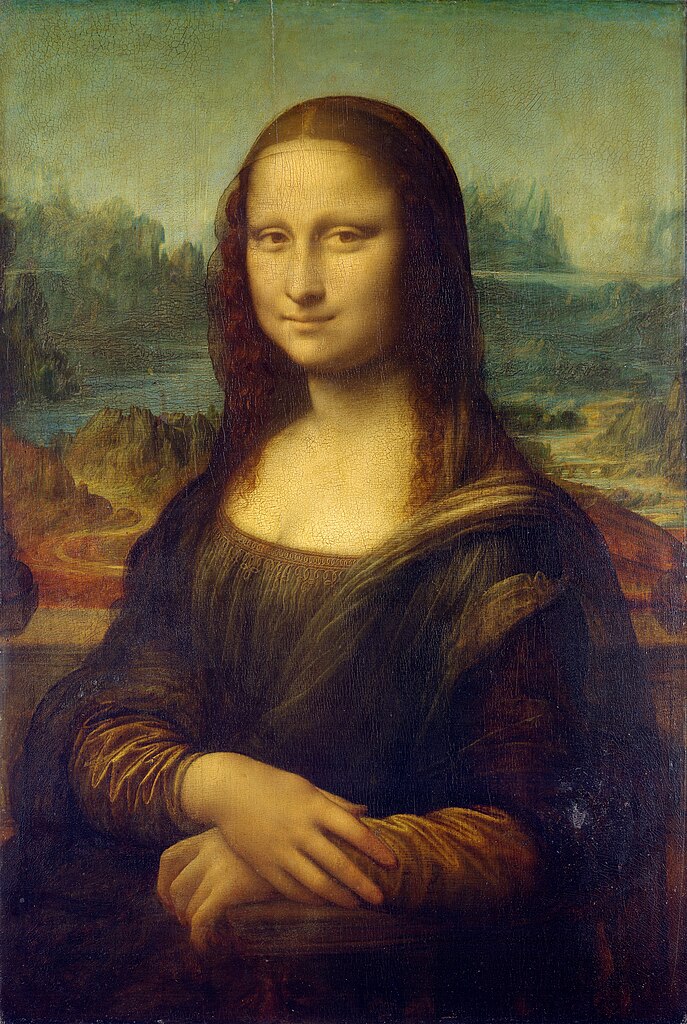
The Visual Display of Quantitative Information. Edward R. Tufte.

[Source]
Visualization
- By encoding information visually, they allow to present large amounts of numbers in a meaninful way.
- If well made, visualizations provide leads into the processes underlying the graphic.
The Visual Display of Quantitative Information. Edward R. Tufte.
Geovisualization
Tufte (1983)
MacEachren (1994)
GeoVisualization
- Not to replace the human in the loop, but to augment her/him.
- Augmentation through engaging the pattern recognition capabilities that our brain inherently has.
- Combines cartography, infovis and statistics
A map for everyone
Maps can fulfill several needs, looking very different depending on the end-goal
MacEachren & Kraak (1997) identify three main dimensions:
- Knowledge of what is being plotted
- Target audience
- Degree of interactivity
MacEachren & Kraak (1997) map cube
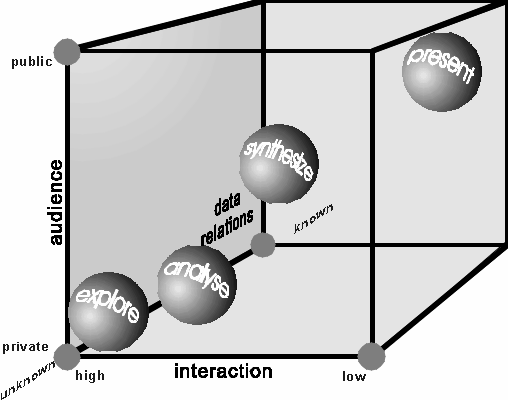
[Source]

A course on Geographic Data Science by Dani Arribas-Bel is licensed under a Creative Commons Attribution-ShareAlike 4.0 International License.