Web Mapping & Analysis
Statistical visualisation
Dani Arribas-Bel
Today
- Visualisation
- (Web) Maps
- Choropleths
Visualisation
What?
Munzner (2016)
When?
A human “superpower”:
- Keep the human in the loop
- Augment memory/internal representation
- Ask new questions rather than only answer existing ones
Why?
- Bridges human and machine
- Relies on vision (high-volume, parallel throughput)
- External representations work around limits of internal cognition/memory
How?
what-why-how↓
data-task-idiom
Most ineffective designs are due to a poor match
Domain-specific → Abstract form
How?
Vis is
- Exploring
- Checking pre-conceived ideas
- Long-term use in workflows/processes
- Presentation
A tool that serves well for one task can be poorly suited for another
Elements (and limitations)
- Computer (time)
- Human (memory & attention)
- Display (capacity)
Design trade-off’s
- Beauty Vs Elegance
- “No picture can communicate the truth, the whole truth, and nothing but the truth” (Munzner, 2016)
- …
Data (Web) Maps
Tufte (1983)
Designing good maps
Maps fulfill several needs
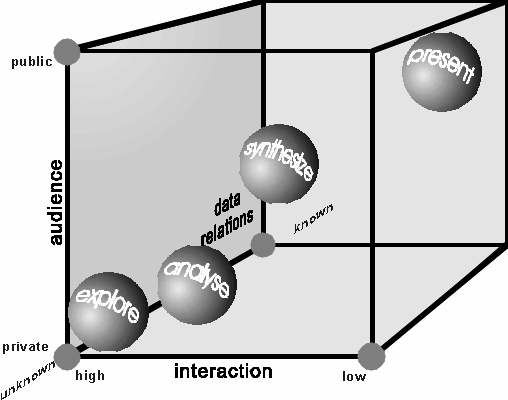
MacEachren & Kraak (1997) identify three main dimensions:
- Knowledge of what is being plotted
- Target audience
- Degree of interactivity
Map Cube
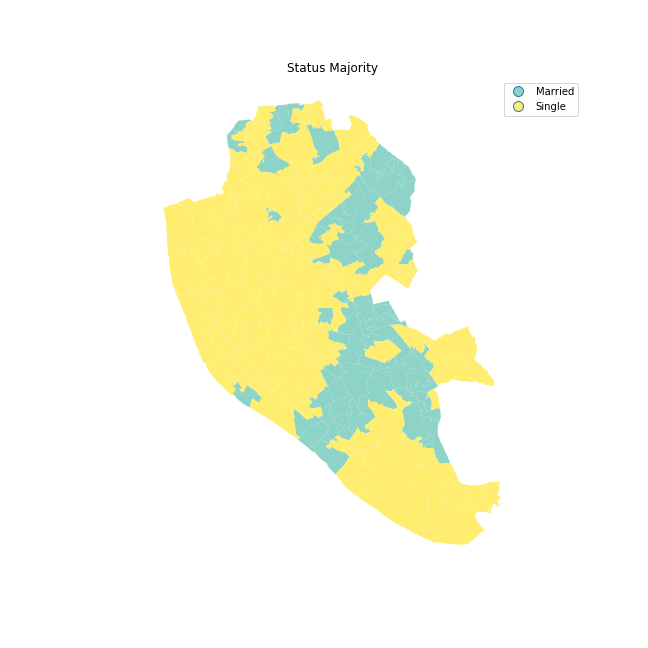
Choropleths
Choropleths
- Encode value using the color channel
- Values are classified into groups (bins)
- Information loss as a trade off for simplicity
Classification choices
- N. of bins
- How to bin?
- Colors
How many bins?
- Trade-off: detail Vs cognitive load
- Exact number depends on purpose of the map
- Usually not more than 12
How to bin?
Unique values
- Categorical data
- No gradient (reflect it with the color scheme!!!)
- Examples: Religion, country of origin…
Unique values
Equal interval
- Take the value span of the data to represent and split it equally
- Splitting happens based on the numerical value
- Gives more weight to outliers if the distribution is skewed
Quantiles
- Regardless of numerical values, split the distribution keeping the same amount of values in each bin
- Splitting based on the rank of the value
- If distribution is skewed, it can put very different values in the same bin
Other
- Fisher-Jenks
- Natural breaks
- Outlier maps: box maps, std. maps…
Color schemes
Align with your purpose
- Categories, non-ordered

- Graduated, sequential

- Graduated, divergent

TIP: check ColorBrewer for guidance
Tips
- Think of the purpose of the map
- Explore by trying different classification alternatives
- Combine (Geo)visualisation with other statistical devices

Web Mapping & Analysis by Dani Arribas-Bel is licensed under a Creative Commons Attribution-ShareAlike 4.0 International License.