Content
W1 Introduction & Context
W2-4: Data Backends
W5: Assignment I
W6-8: Frontend Topics
W9: Dashboards
W10: Technology Gallery
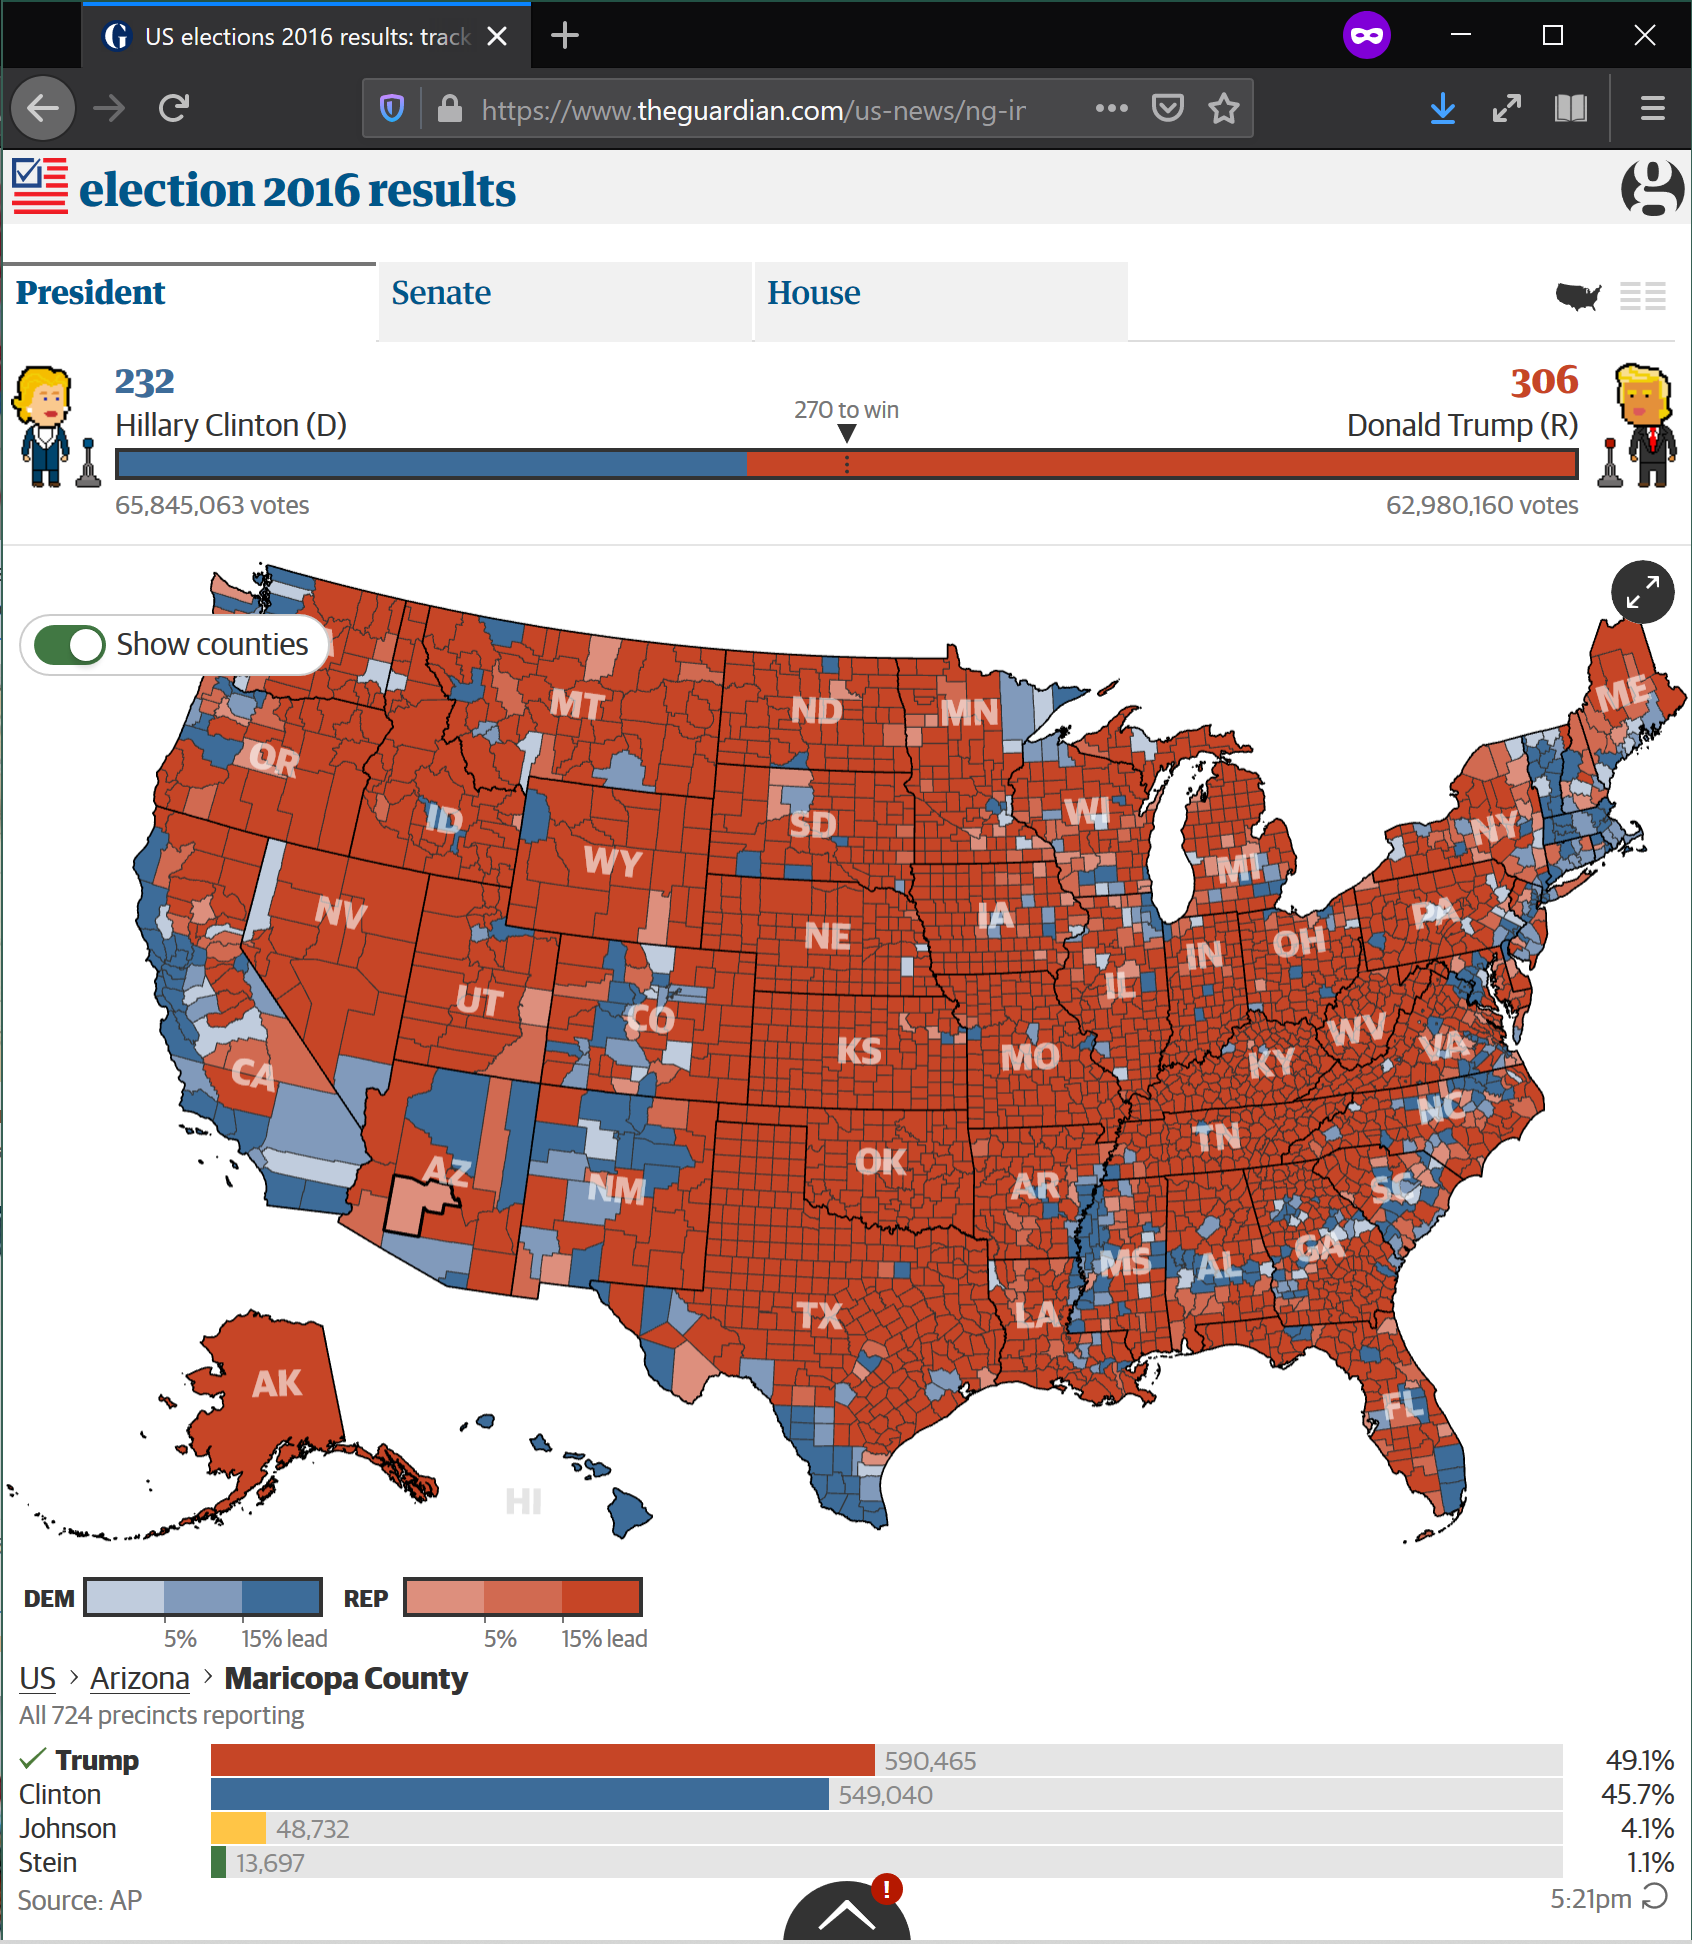
“Data graphics visually display measured quantities by means of the combined use of points, lines, a coordinate system, numbers, symbols, words, shading, and color”
The Visual Display of Quantitative Information. Edward R. Tufte

|
|

url
|
|
|
|
url
|
W1 Introduction & Context
W2-4: Data Backends
W5: Assignment I
W6-8: Frontend Topics
W9: Dashboards
W10: Technology Gallery
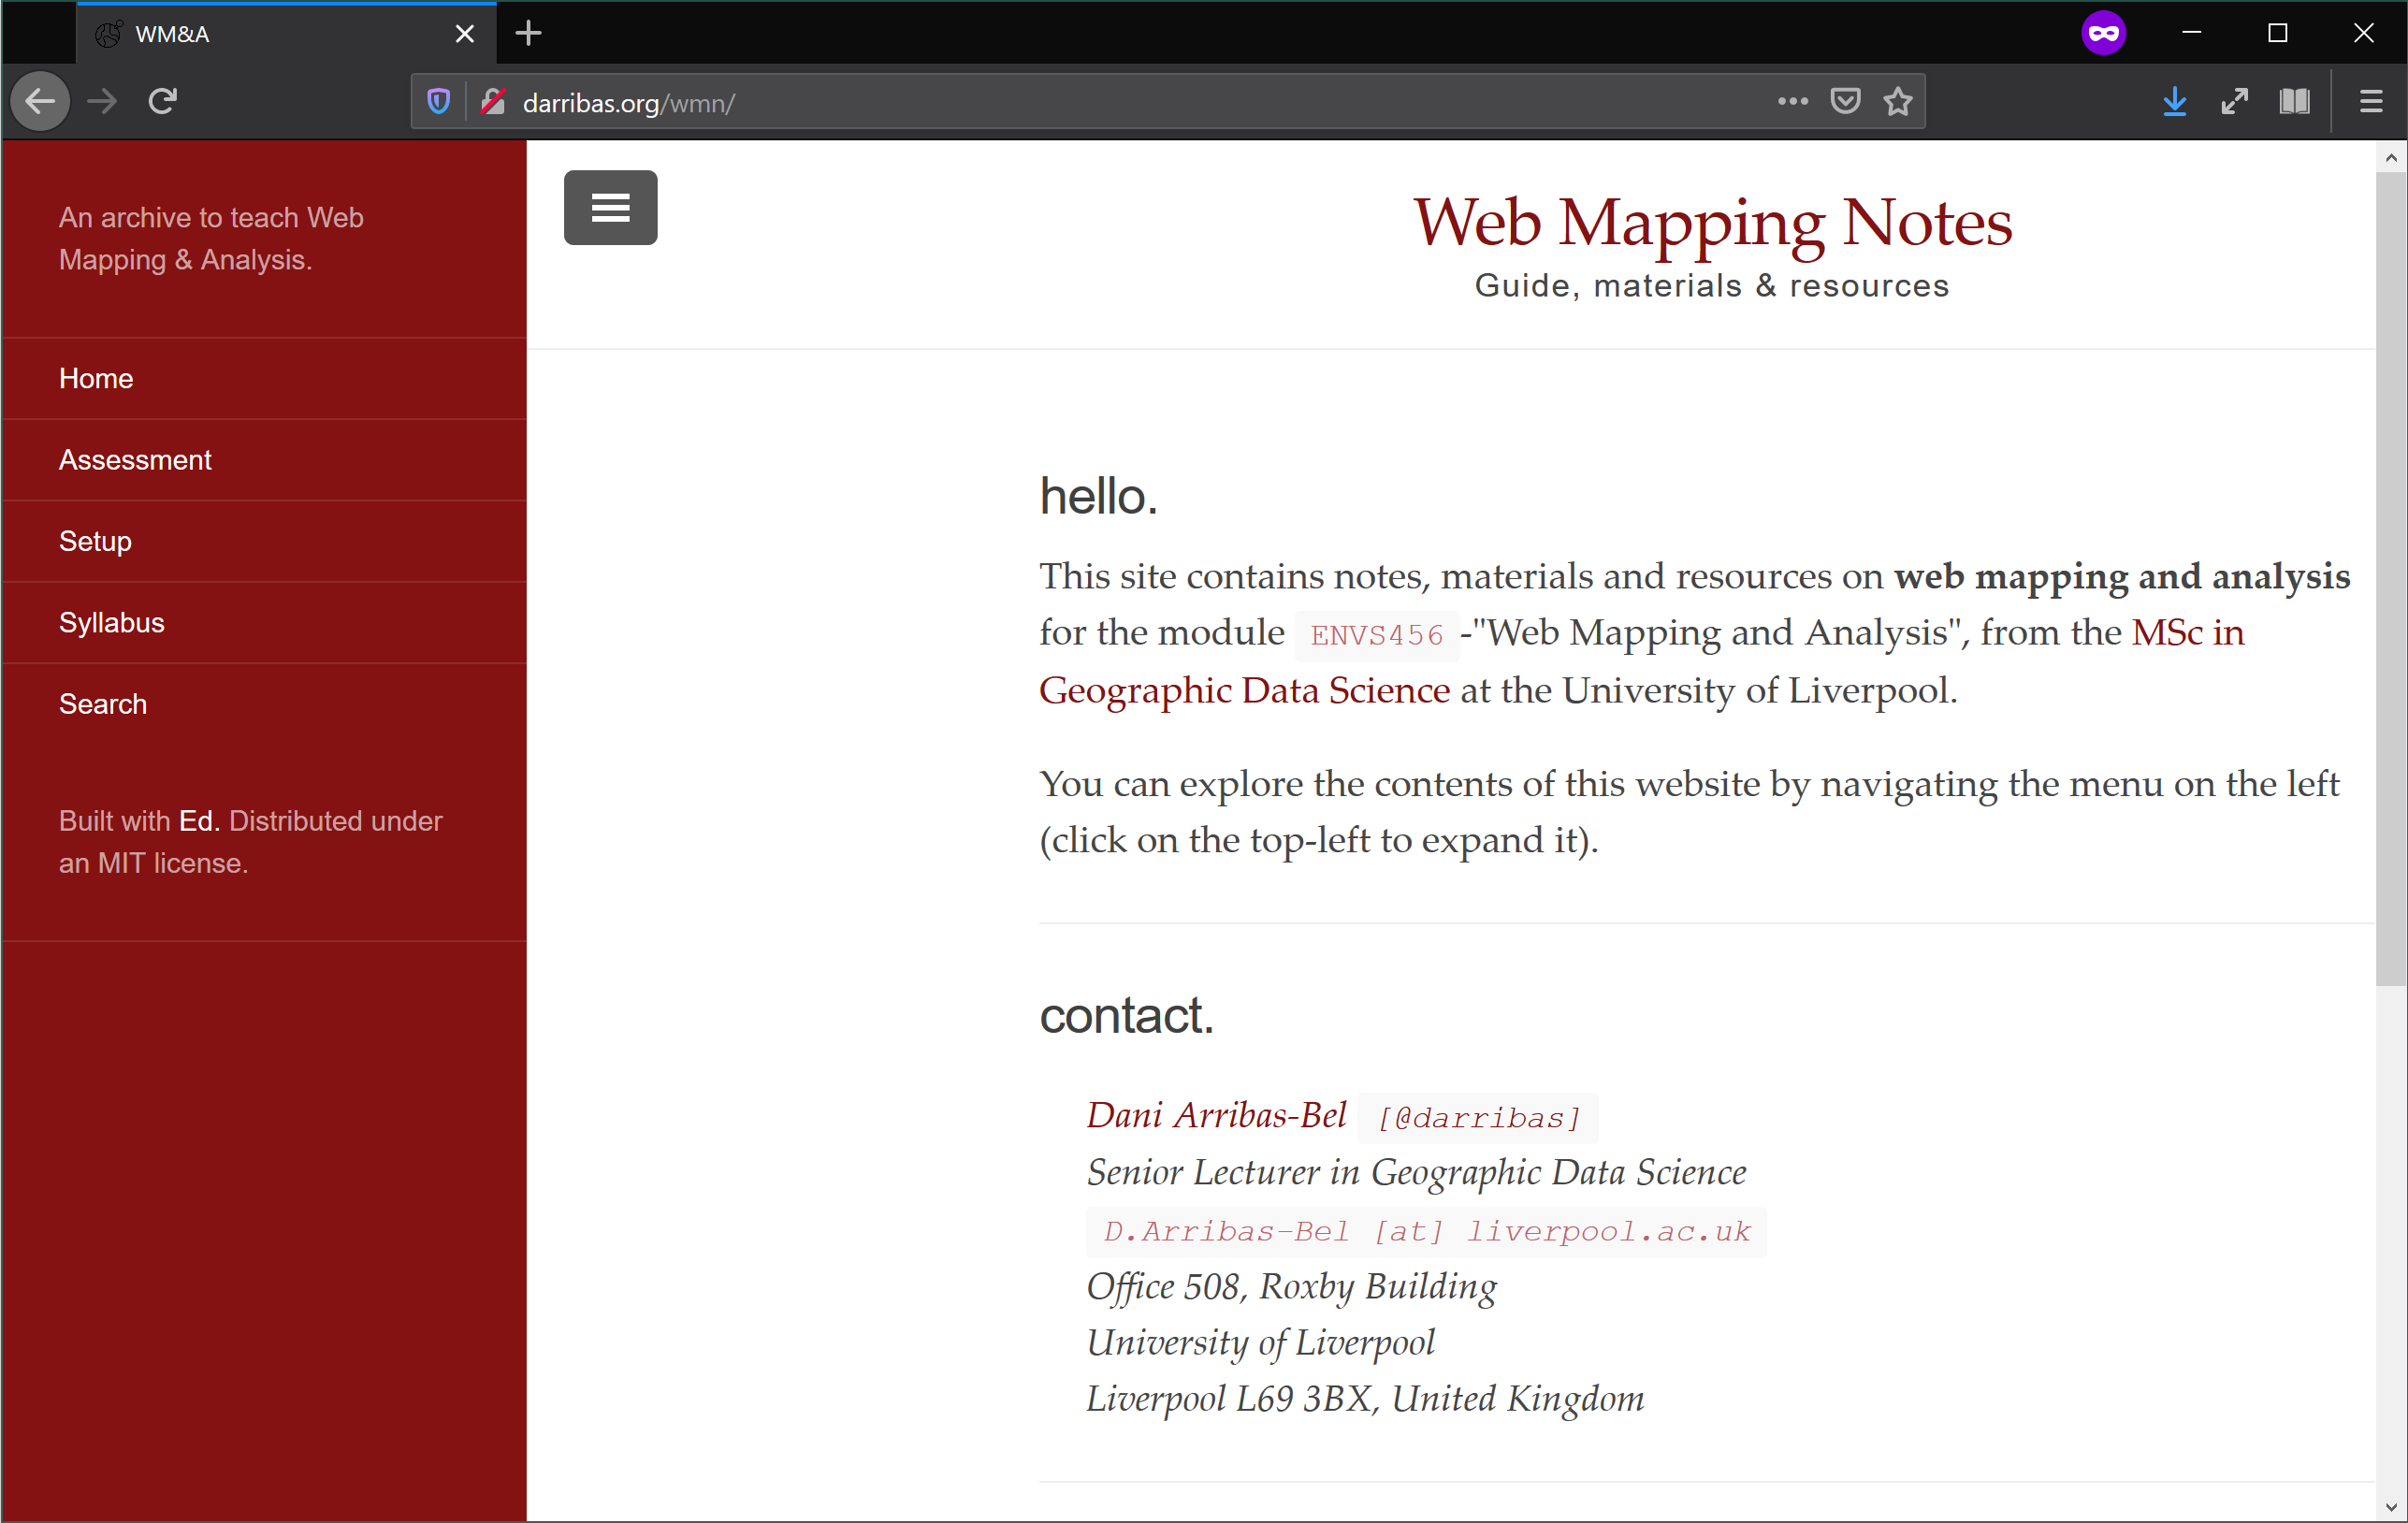
darribas.org/wmn
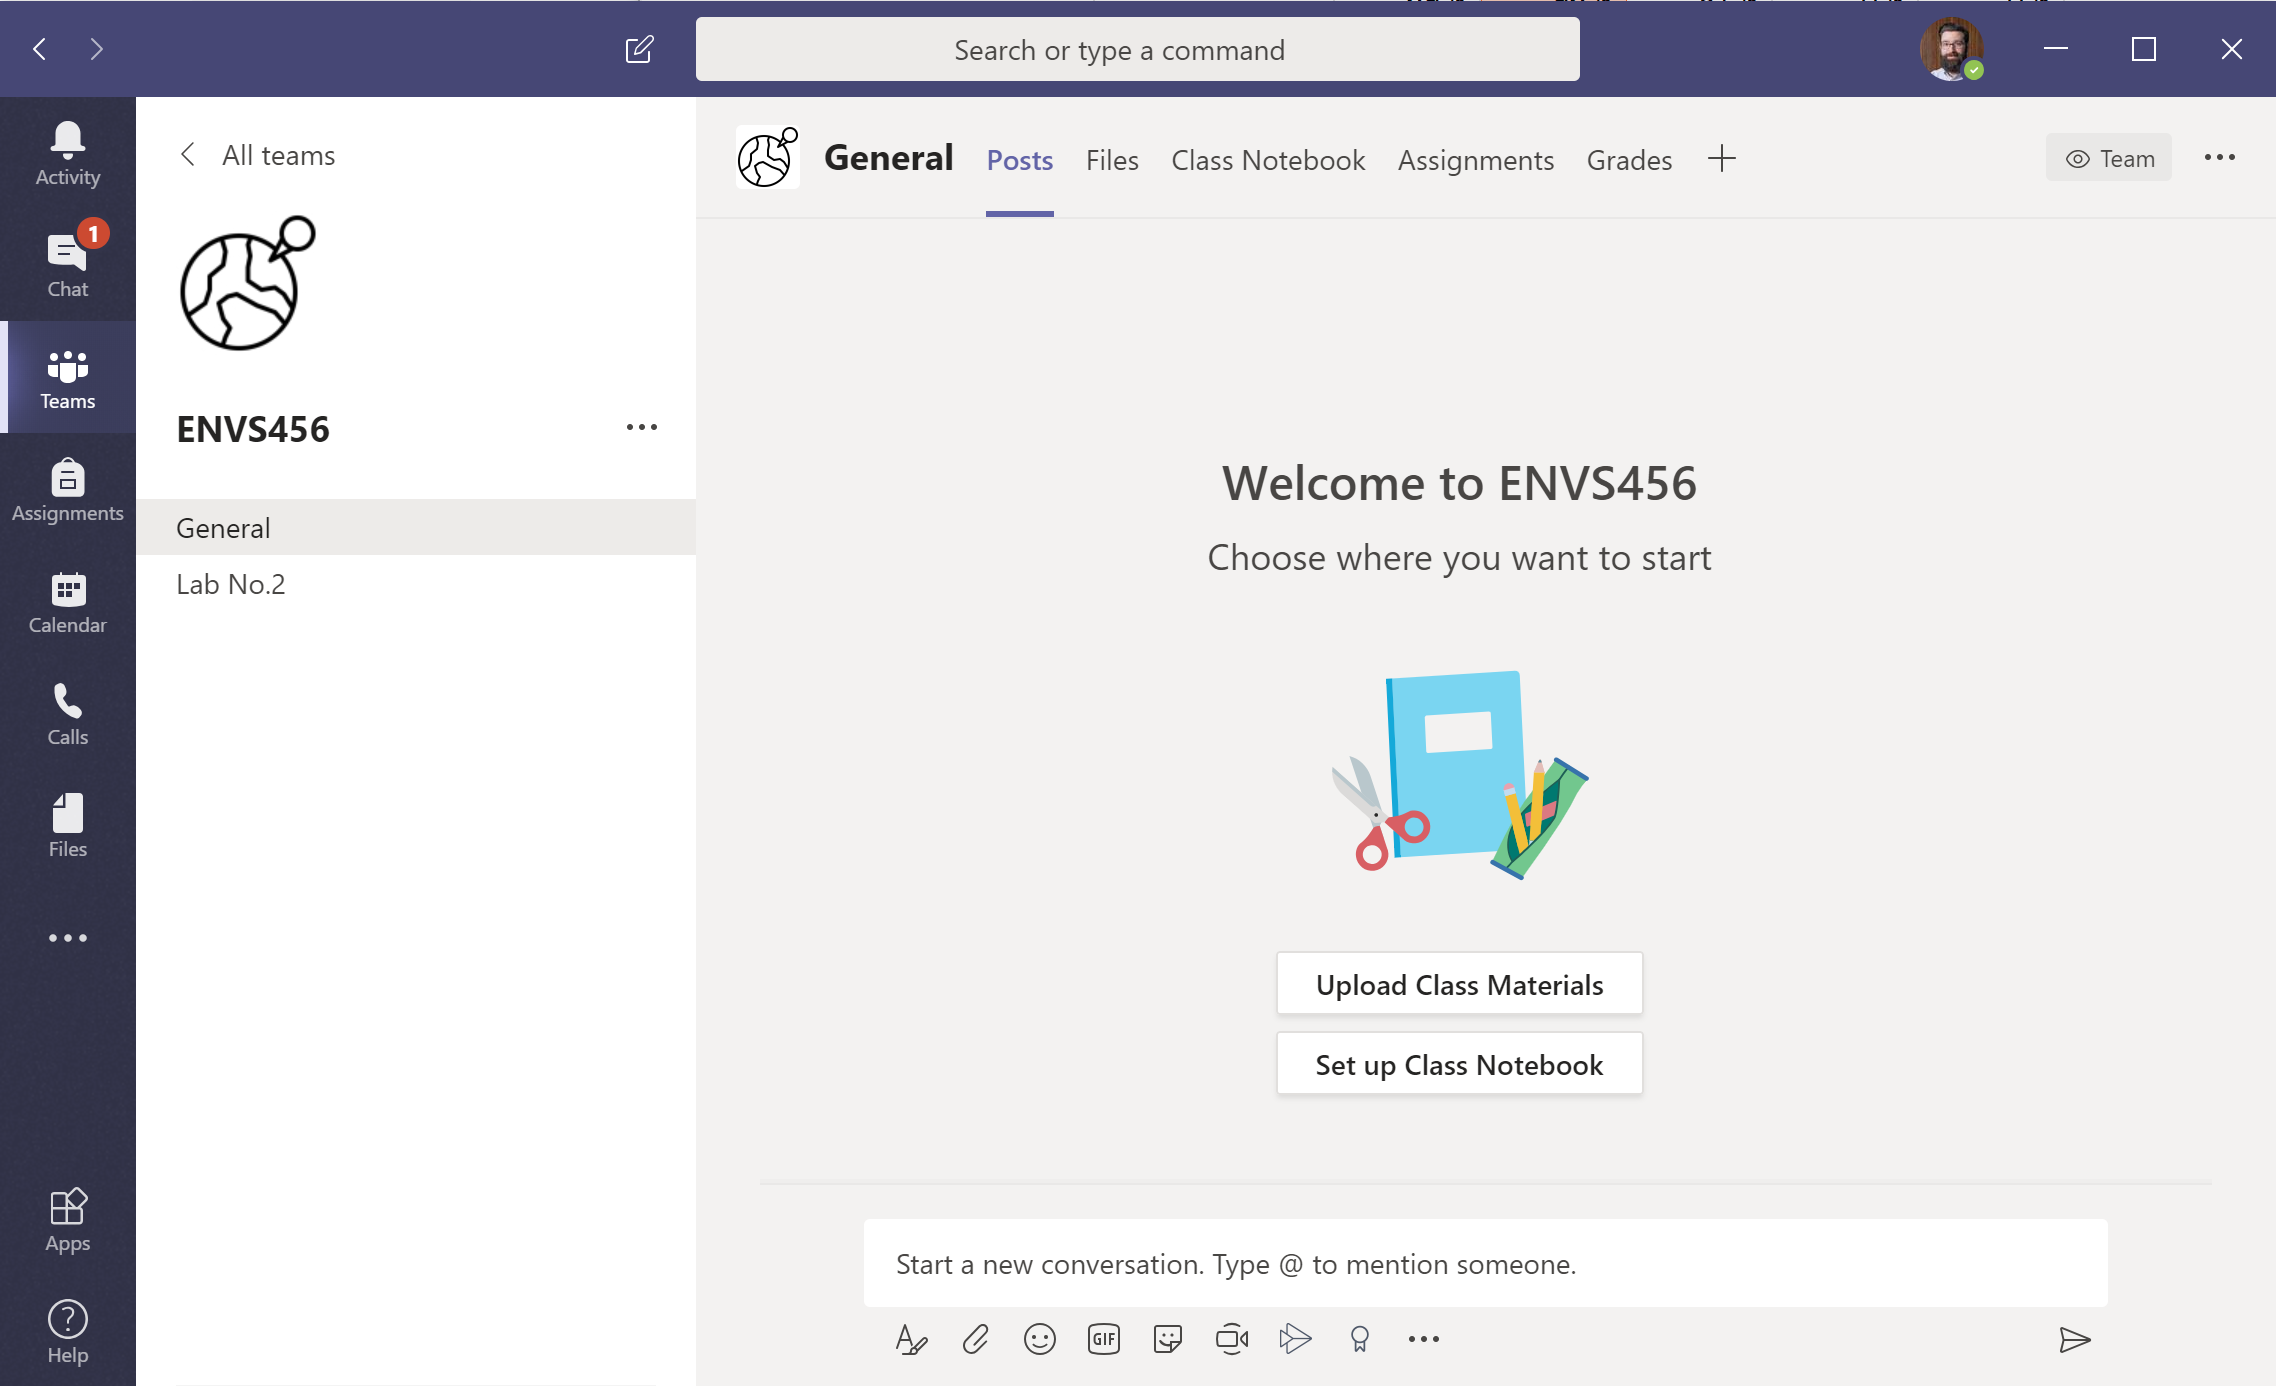
Lectures: Fridays 1pm-2pm @Teams
Labs: Fridays 3pm-5pm @Teams

Web Mapping & Analysis by Dani Arribas-Bel is licensed under a Creative Commons Attribution-ShareAlike 4.0 International License.