Geographic Data Science - Lecture VI
Exploring Space in Data
Dani Arribas-Bel
Today
- ESDA
- Spatial Autocorrelation
Measures
- Global
- Local
ESDA
Exploratory
Spatial
Data
Analysis
[Exploratory]
Focus on discovery and assumption-free investigation
[Spatial]
Patterns and processes that put space and geography at the core
[Data Analysis]
Statistical techniques
Questions that ESDA helps…
Answer
- Is the variable I’m looking at concentrated over space? Do similar values tend to locate closeby?
- Can I identify any particular areas where certain values are clustered?
Ask
- What is behind this pattern? What could be generating the process?
- Why do we observe certain clusters over space?
Spatial Autocorrelation
Waldo Tobler (1970)
Spatial Autocorrelation
-Statistical representation of Tobler’s law
-Spatial counterpart of traditional correlation
Degree to which similar values are located in similar locations
Two flavors:
- Positive: similar values → similar location (closeby)
- Negative: similar values → disimilar location (further apart)
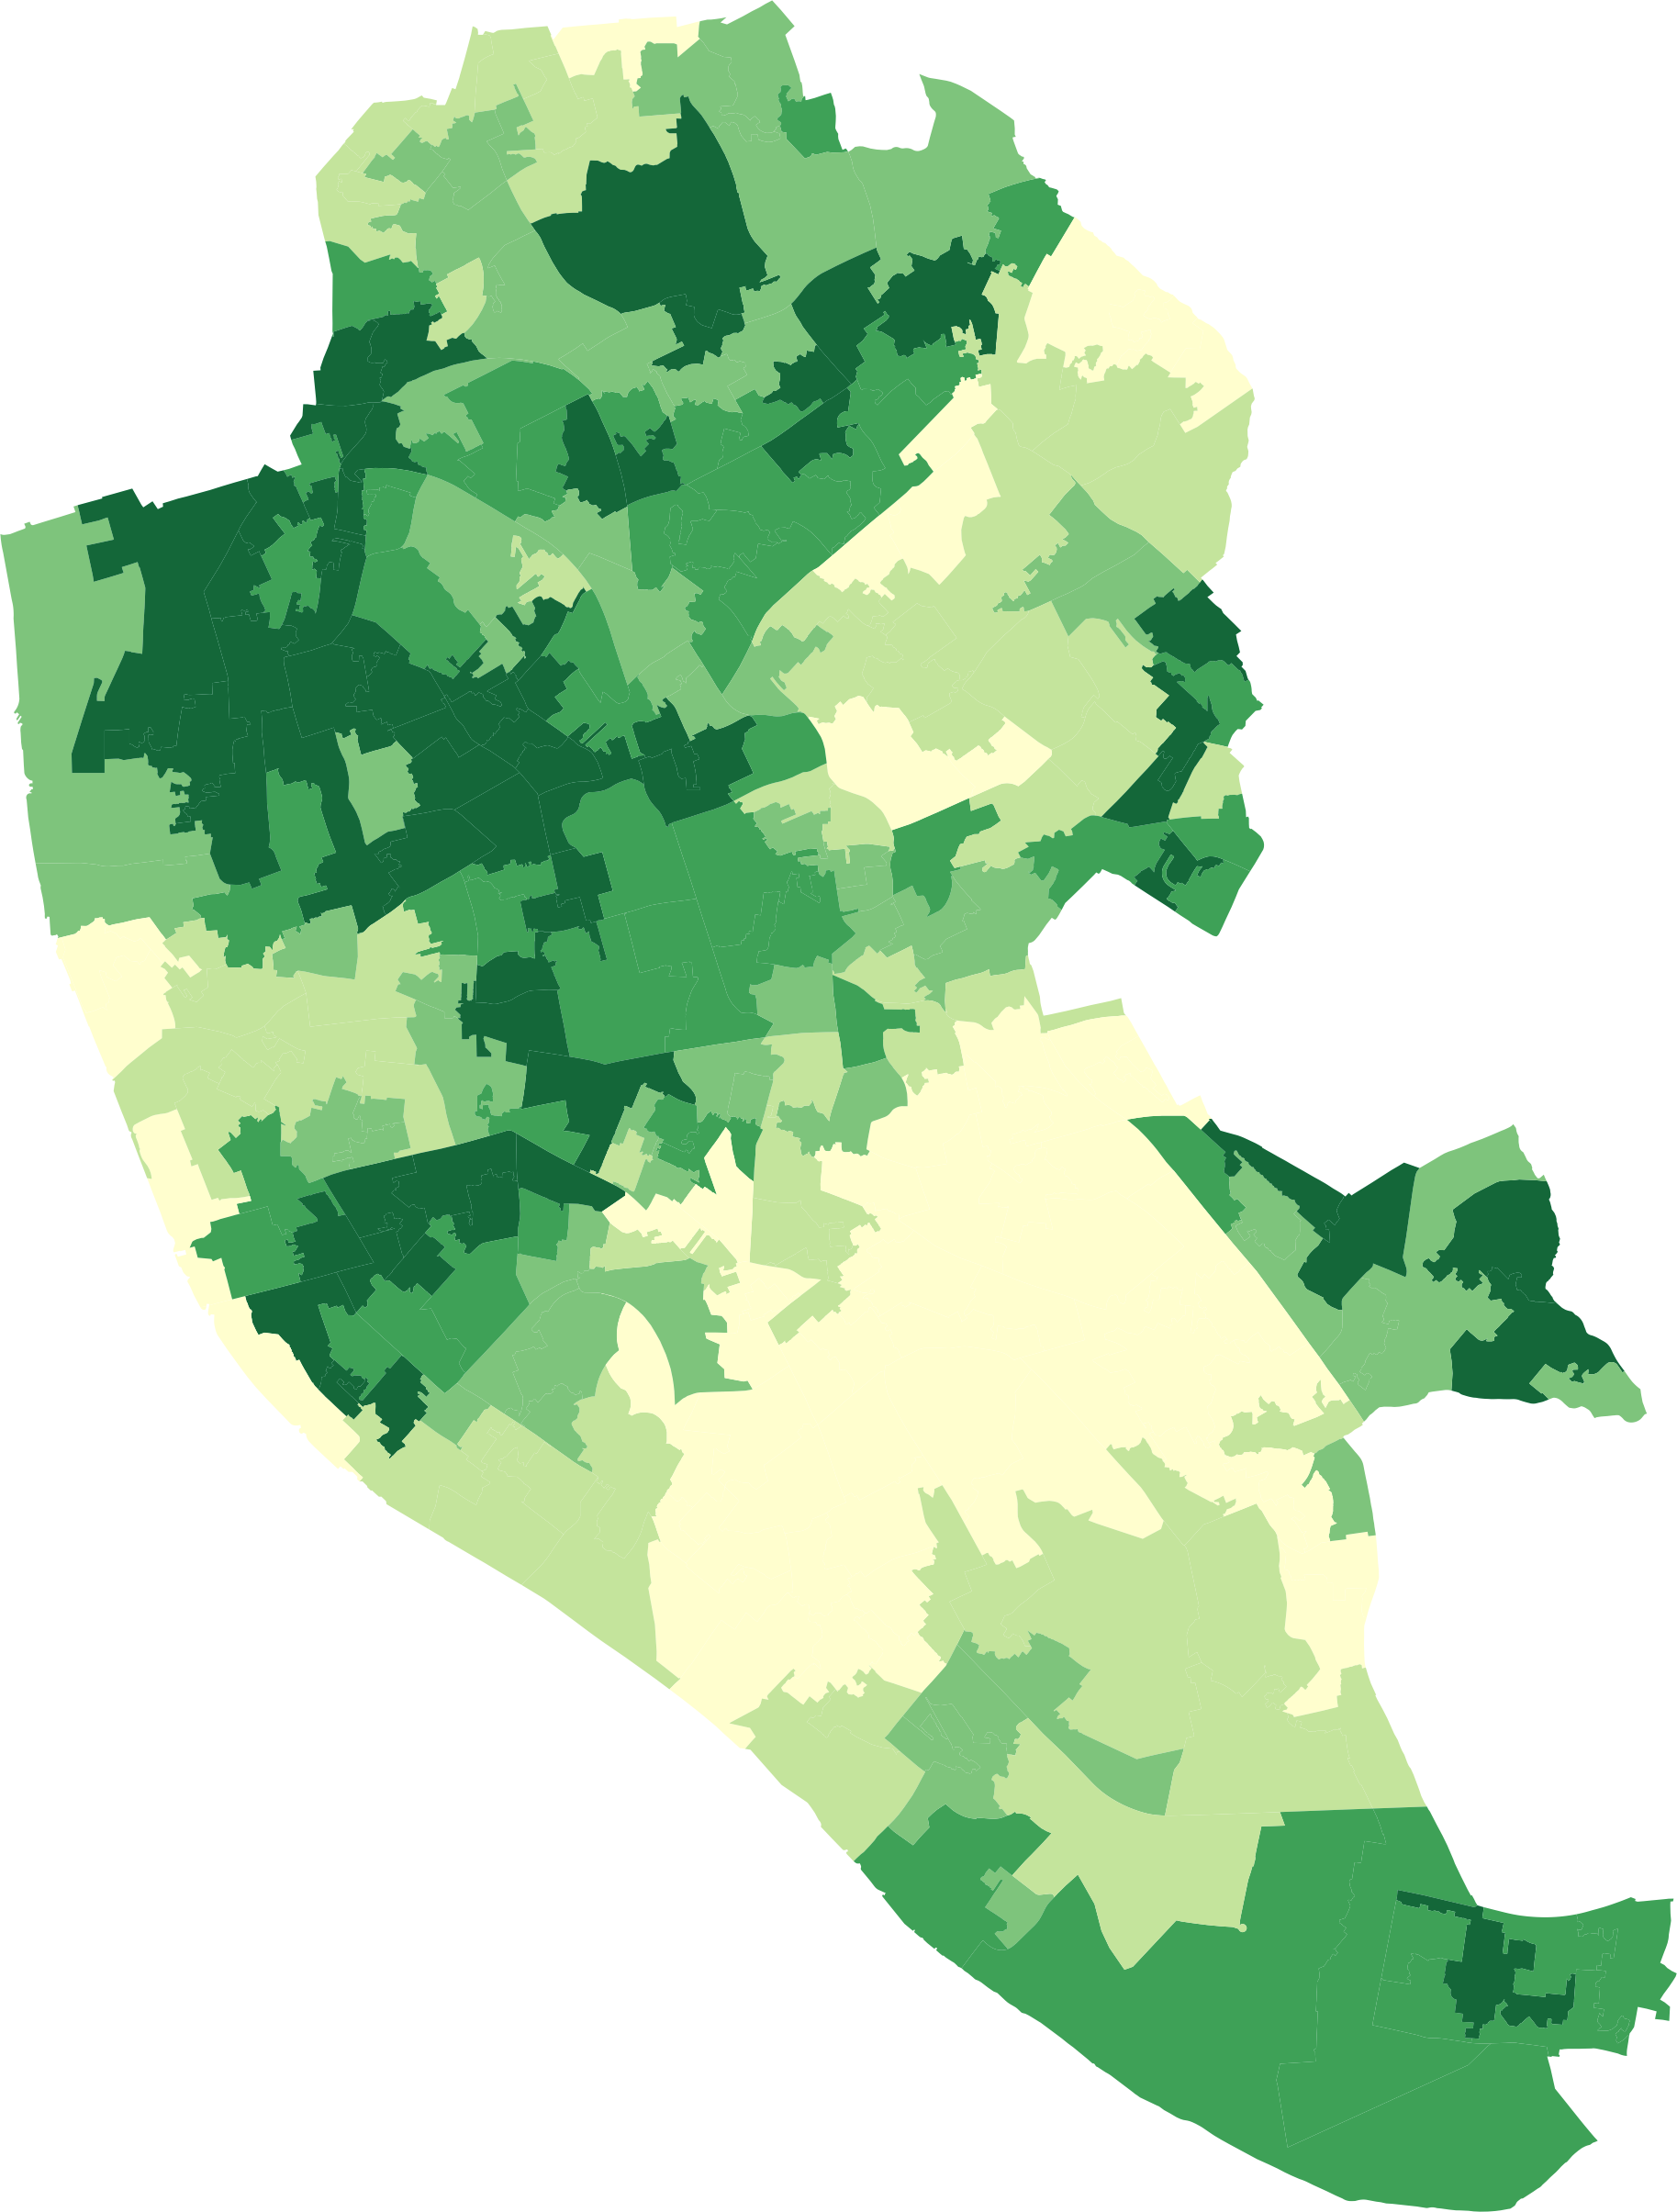
Examples
Positive SA: income, poverty, vegetation, temperature…
Negative SA: supermarkets, police stations, fire stations, hospitals…
Scales
[Global]
Clustering: do values tend to be close to other (dis)similar values?
[Local]
Clusters: are there any specific parts of a map with an extraordinary concentration of (dis)similar values?
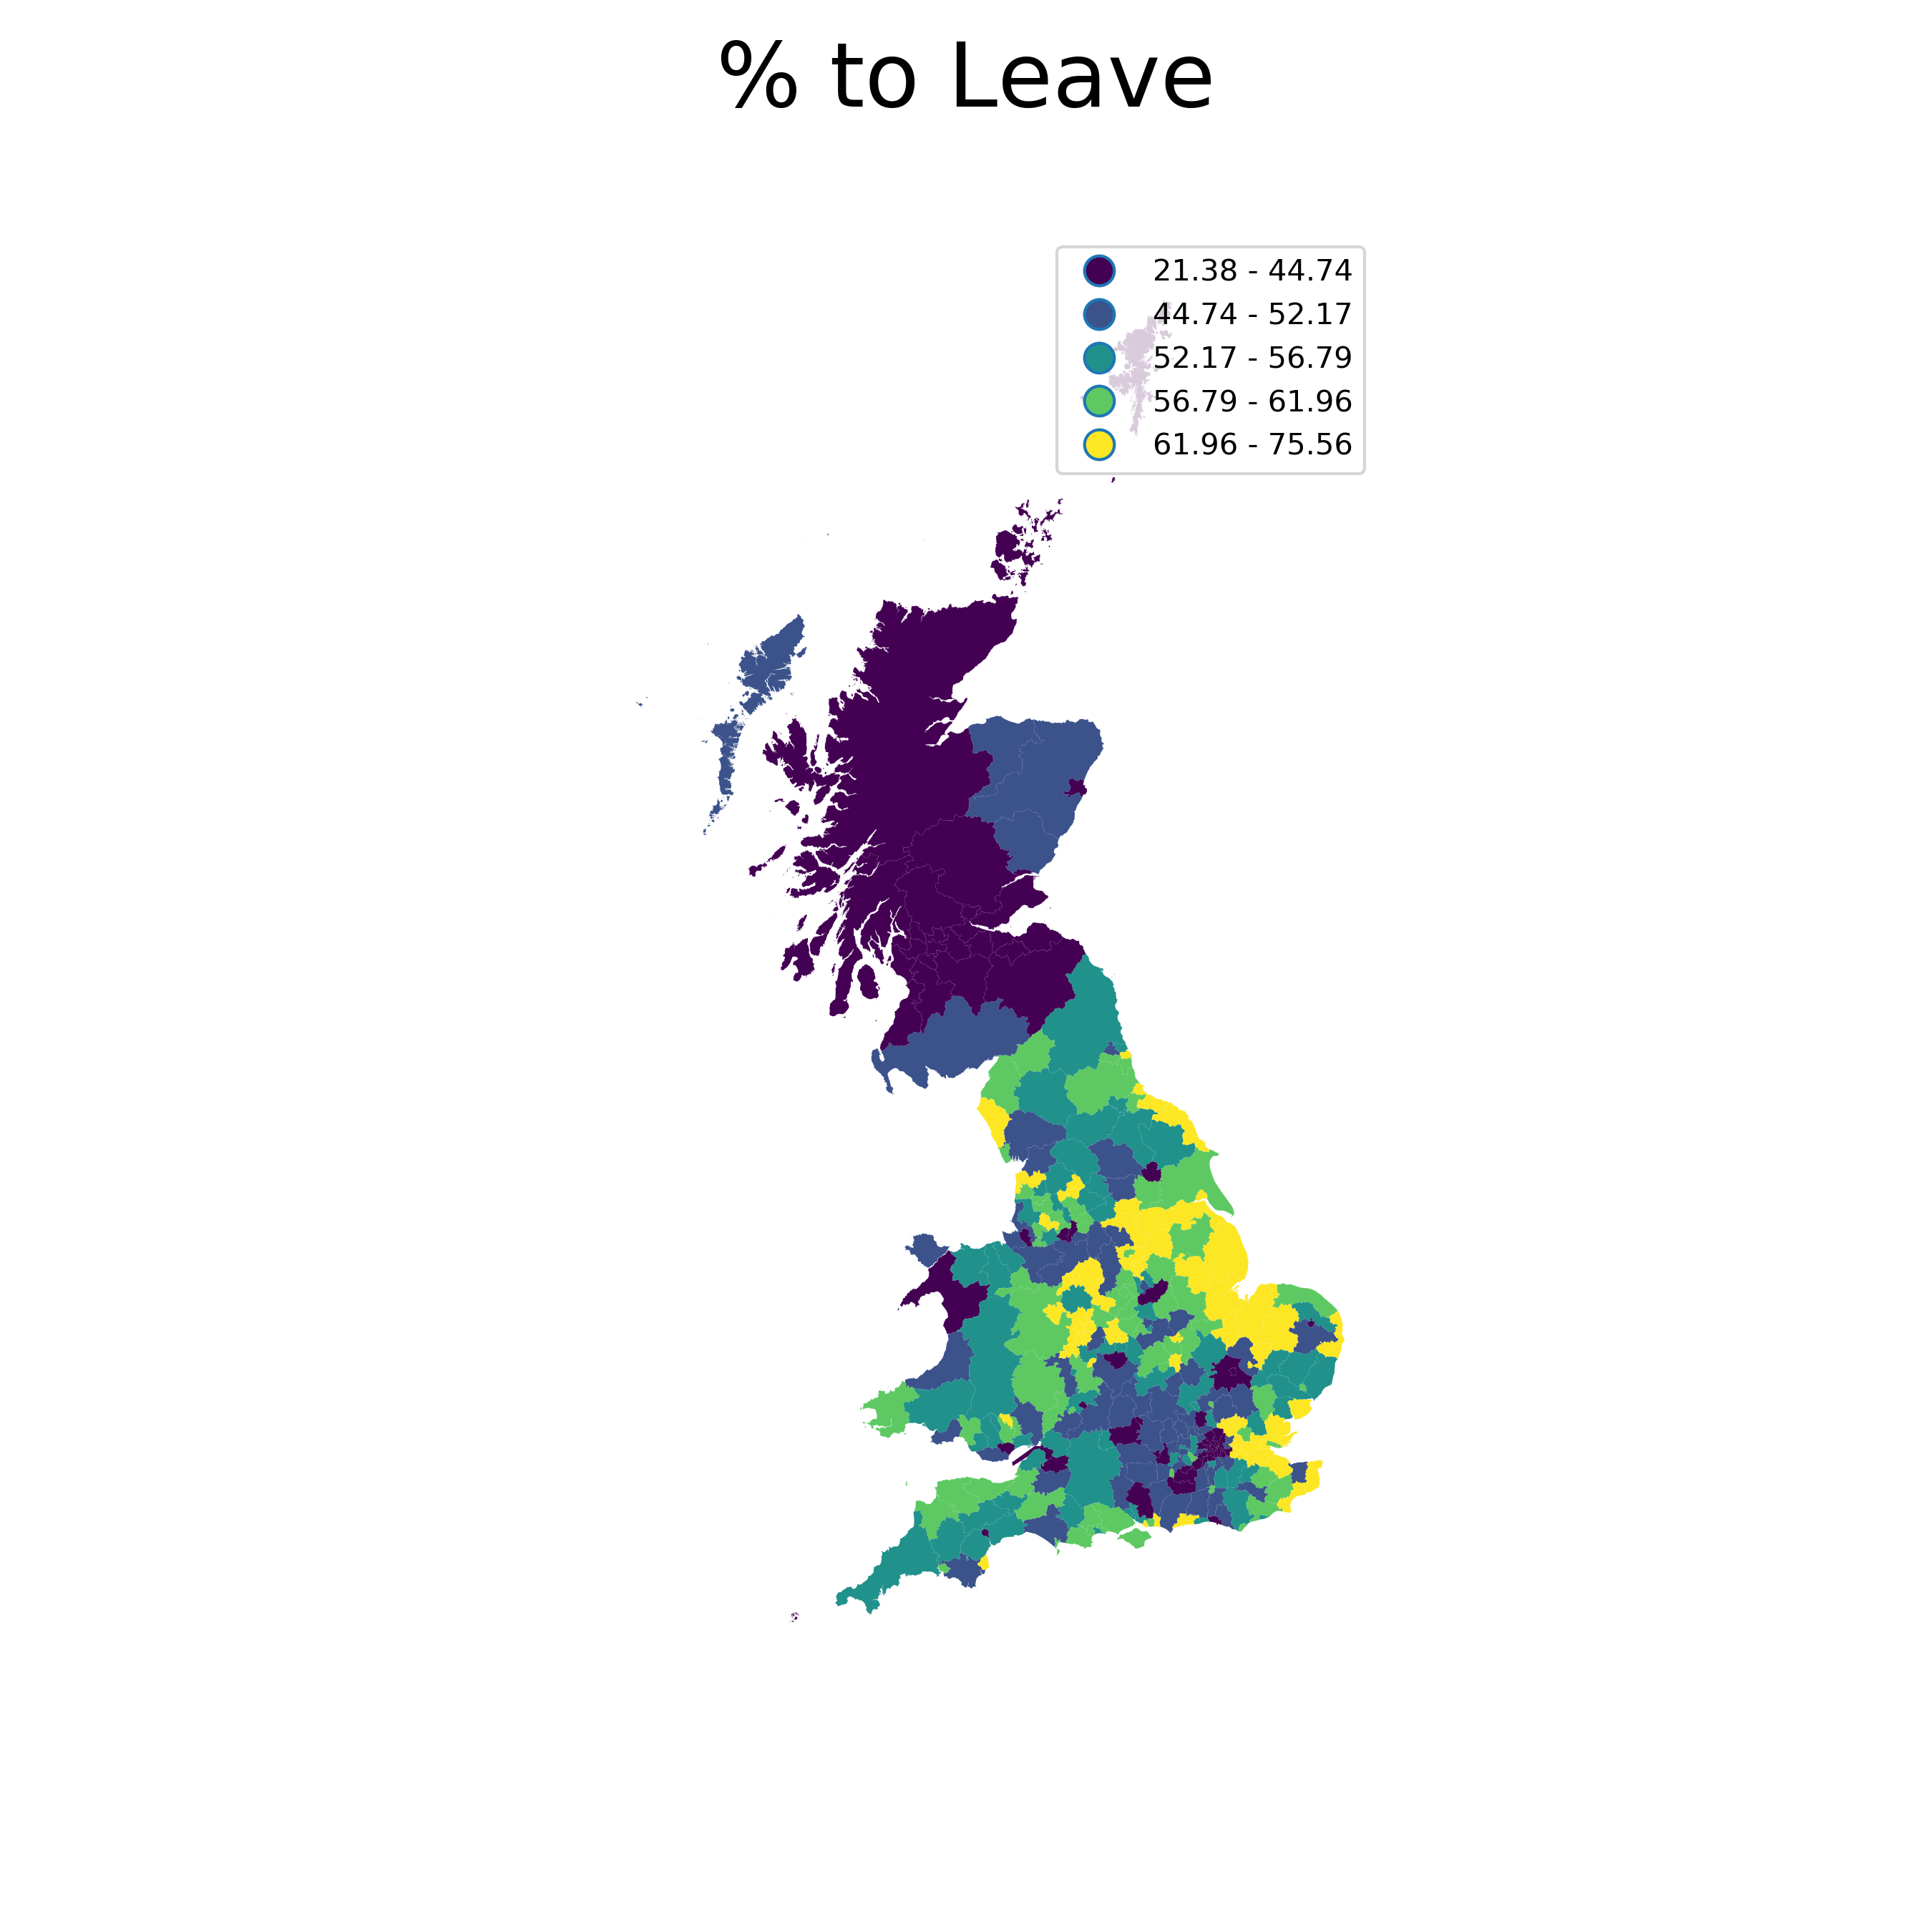
Global Spatial Autocorr.
Global Spatial Autocorr.
“Clustering”
Overall trend where the distribution of values follows a particular pattern over space
[Positive] Similar values close to each other (high-high, low-low)
[Negative] Similar values far from each other (high-low)
How to measure it???
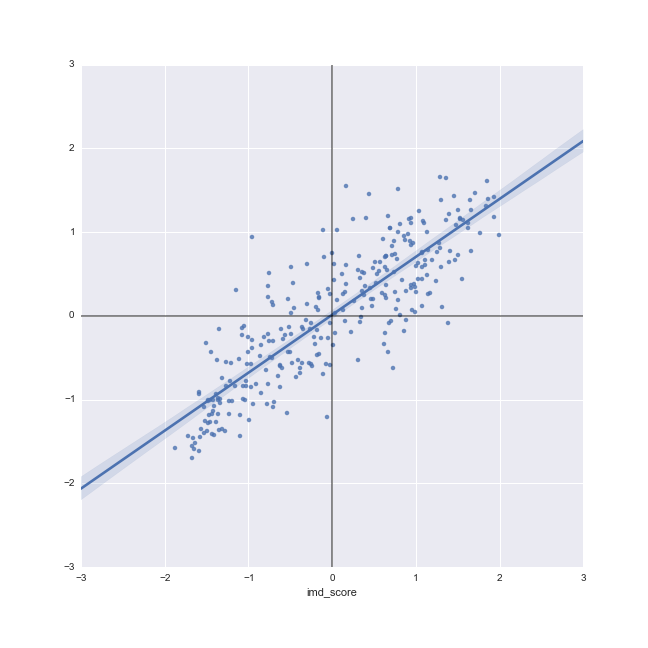
Moran Plot
- Graphical device that displays a variable on the horizontal axis against its spatial lag on the vertical one
- Variable and spatial weights matrix are preferably standardized
- Asssessment of the overall association between a variable in a given location and in its neighborhood
[Interactive Demo]
Moran’s I
Formal test of global spatial autocorrelation
Statistically identify the presence of clustering in a variable
Slope of the Moran plot
Inference based on how likely it is to obtain a map like observed from a purely random pattern
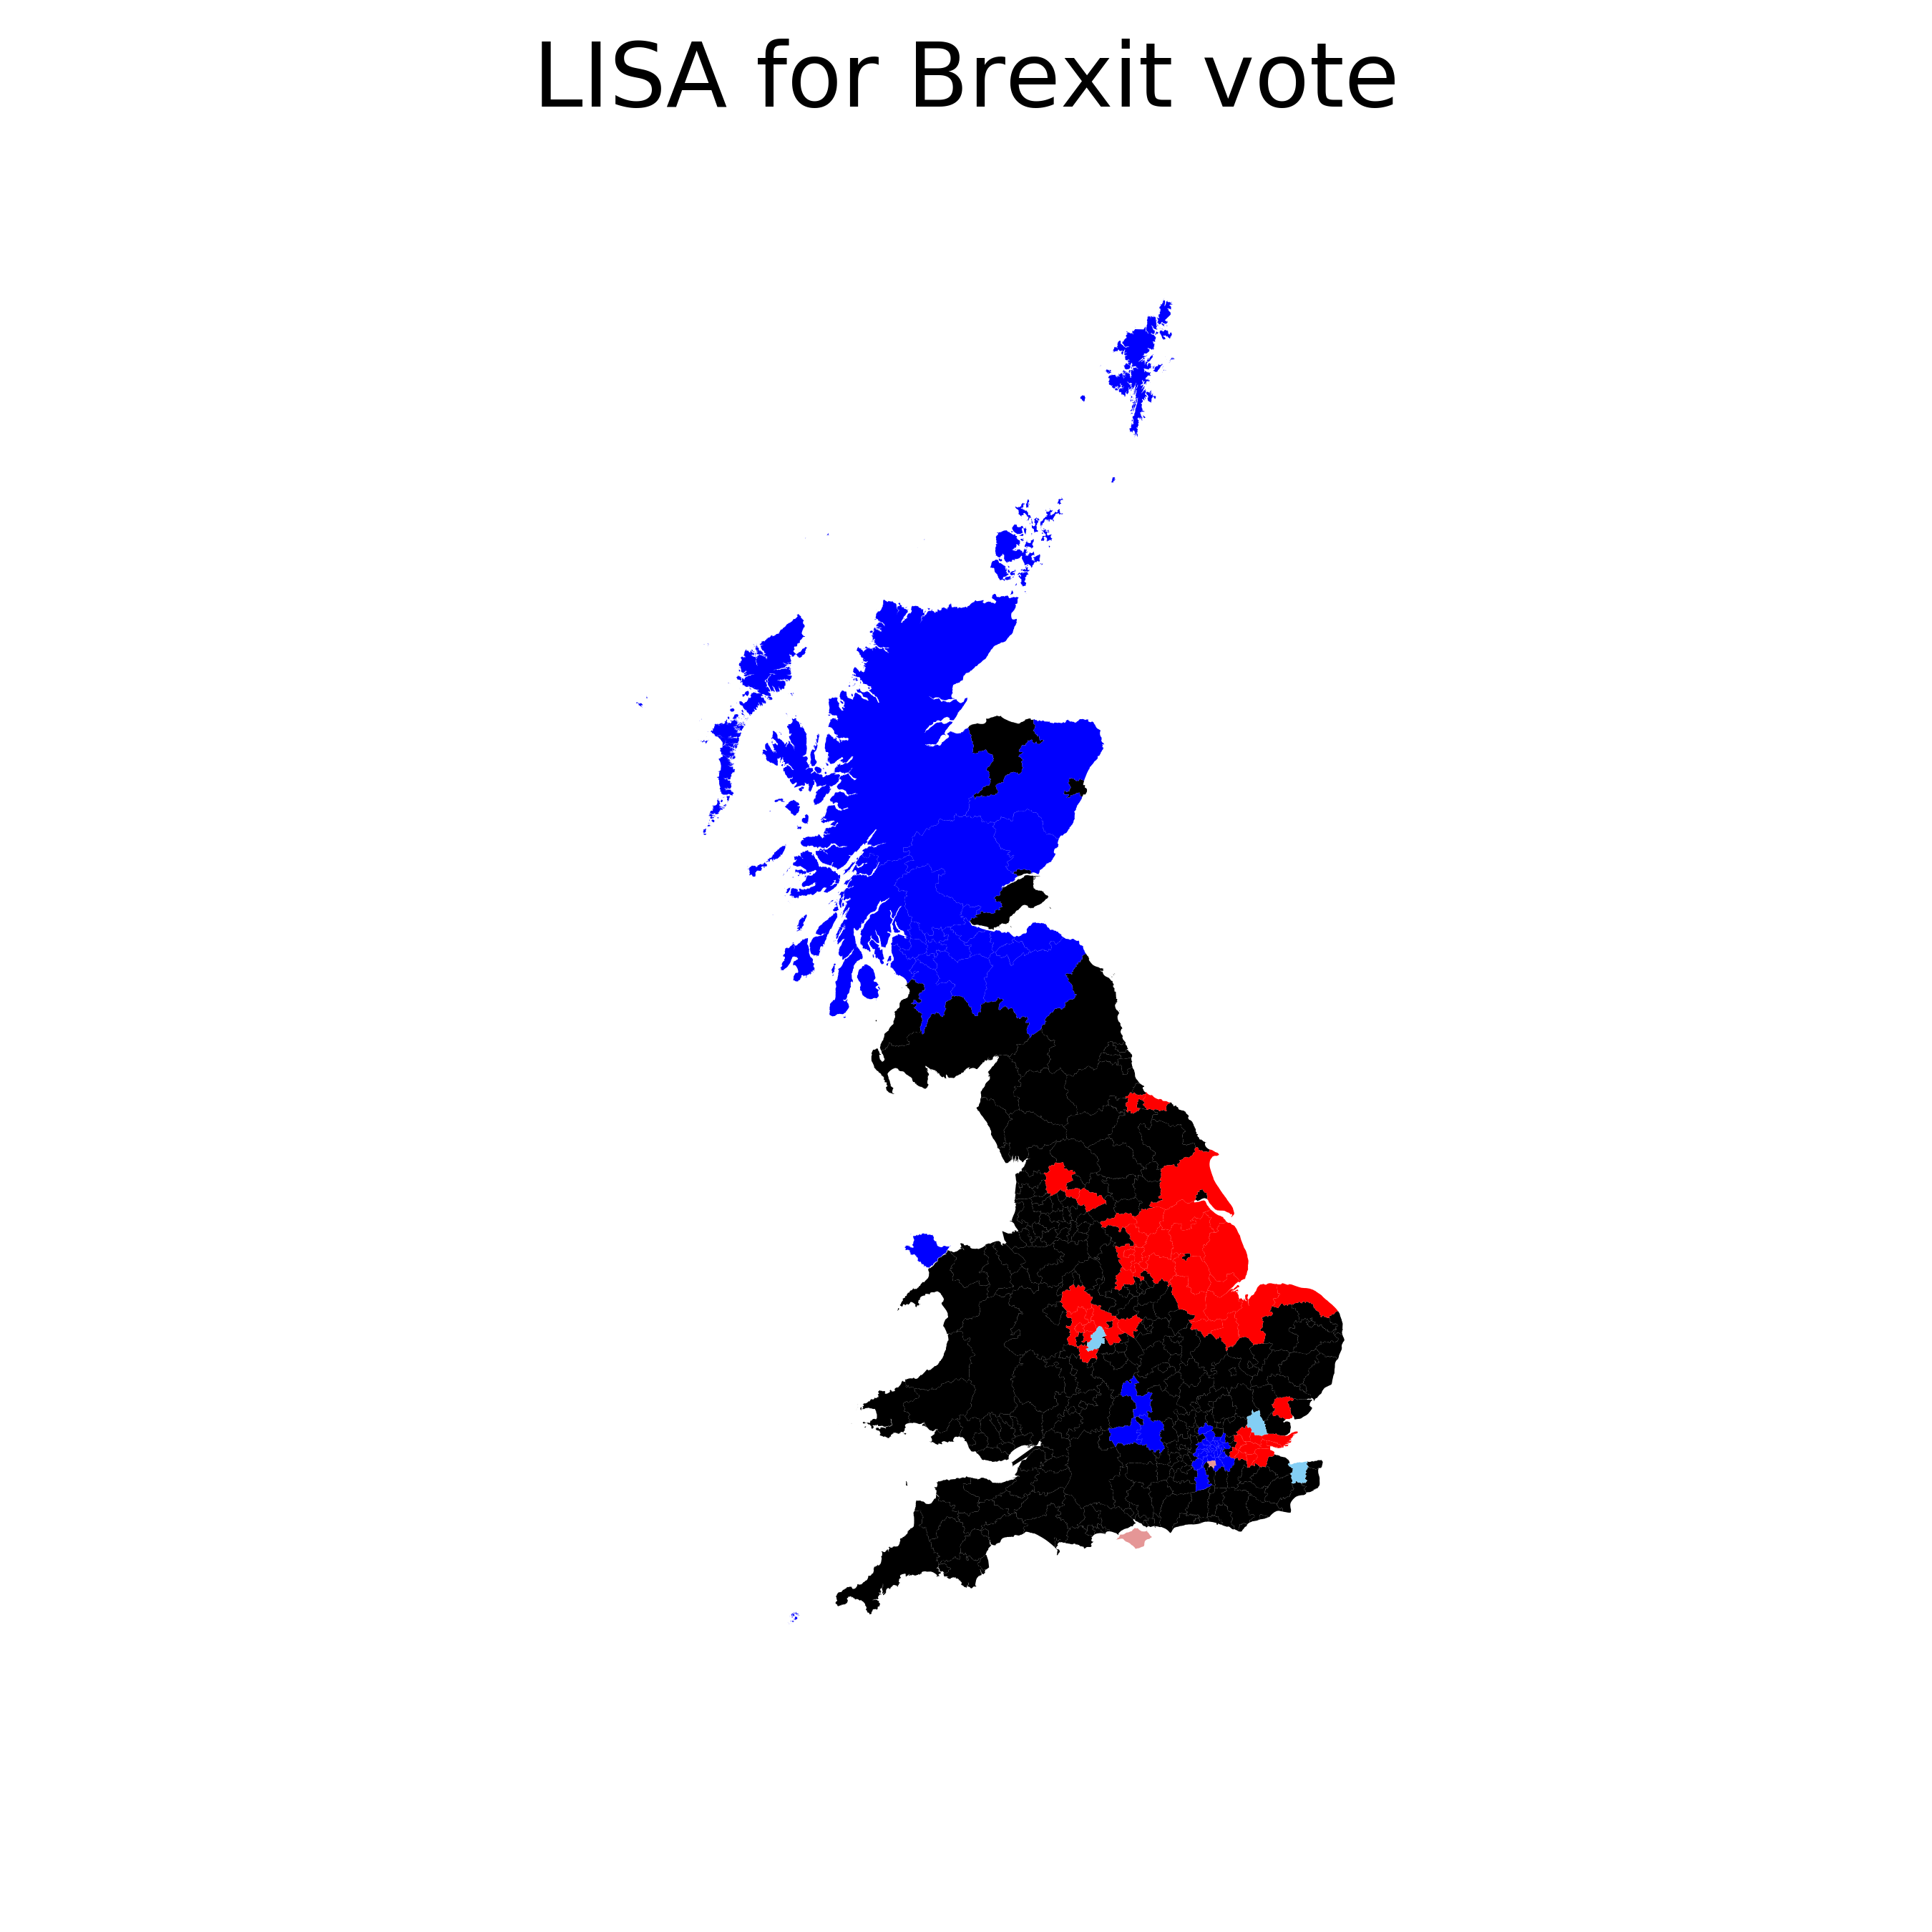
Local Spatial Autocorr.
Local Spatial Autocorr.
“Clusters”
Pockets of spatial instability
Portions of a map where values are correlated in a particularly strong and specific way
[High-High] + SA of high values (hotspots)
[Low-Low] + SA of low values (coldspots)
[High-Low] - SA (spatial outliers)
[Low-High] - SA (spatial outliers)
LISAs
Local Indicators of Spatial Association
Statistical tests for spatial cluster detection → Statistical significance
Compares the observed map with many randomly generated ones to see how likely it is to obtain the observed associations for each location
Recapitulation
ESDA is a family of techniques to explore and spatially interrogate data
Main function: characterize spatial autocorrelation, which can be explored:
- Globally (e.g. Moran Plot, Moran’s I)
- Locally (e.g. LISAs)

Geographic Data Science’18 by Dani Arribas-Bel is licensed under a Creative Commons Attribution-ShareAlike 4.0 International License.