Content
- Weeks 1-3: “big picture” lectures + introduction to computational tools (learning curve)
- Weeks 4-9: “meat” of the course (lots of concepts packed) + Week 7 break
- Weeks 10-11: catch up + prepare an awesome Computational Esssay
More stats than a GIS course… more GIS than a stats course
With a few twists!
11 weeks of:
[URL]
Driving Vs automobile engineering

Prepare for the labs
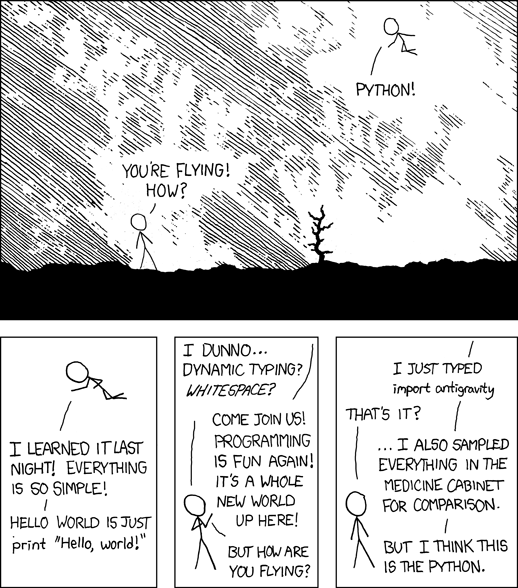
This course is much more about “learning to learn” and problem solving rather than acquiring specific programming tricks or stats wizardry
NOTE: recommendation letters only for great students (>70)
Exciting times to be a:
The world is being “datafied”…
Quantification of phenomena through the systematic recording of data, “taking all aspects of life and turning them into data” (Cukier & Mayer-Schoenberg)
Examples: credit transactions, public transit, tweets, facebook likes, spotify songs, etc.
Many implications:
Advances in:
The confluence of the three (computing, communication and geospatial) is creating large amounts of data.
Now, data in itself is not very valuable:
Methods, tools and techniques to turn data into actionable knowledge
Statistics + …
Some examples…
Some examples…
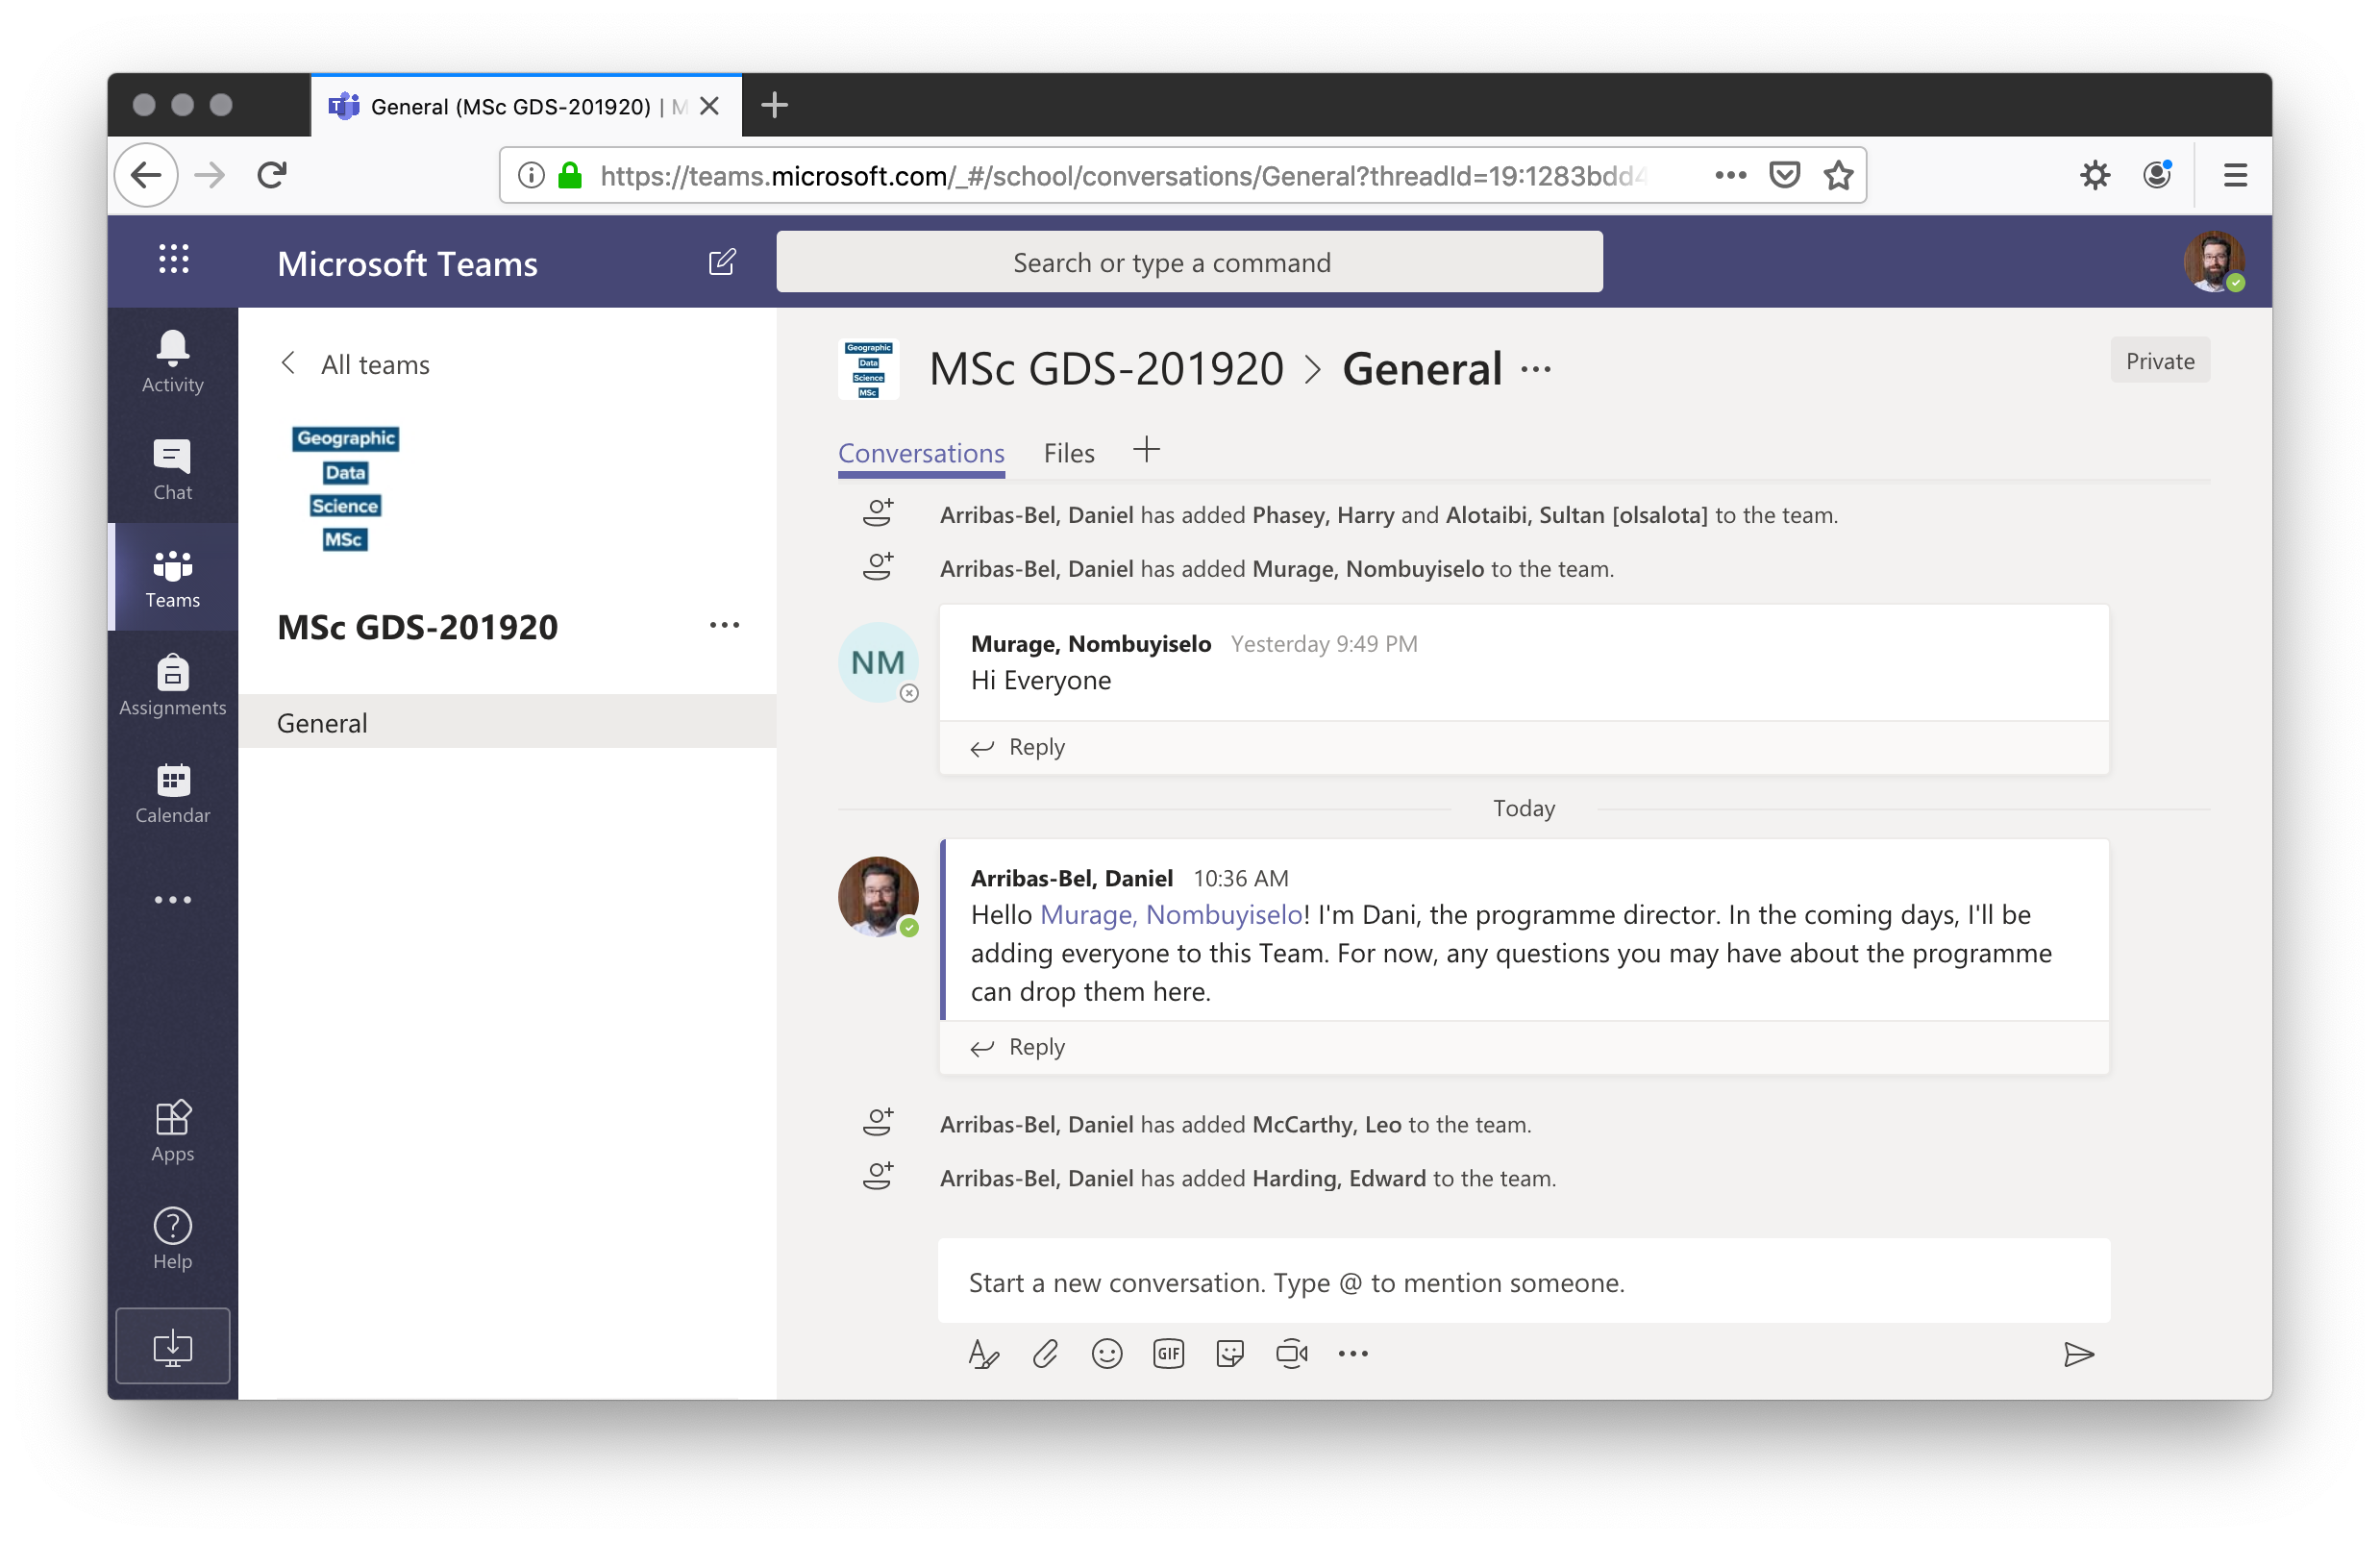
JupyterLab channel created on Teams
Geographic Data Science’19 by Dani Arribas-Bel is licensed under a Creative Commons Attribution-ShareAlike 4.0 International License.