Geographic Data Science - Lecture VIII
Points
Dani Arribas-Bel
Today
- The point of points
- Point patterns
- Visualization of point patterns
The point of points
Points like polygons
Points can represent "fixed" entities
In this case, points are qualitatively similar to polygons/lines
The goal here is, taking location fixed, to model other aspects of the data
Points like polygons
Examples:
- Cities (in most cases)
- Buildings
- Polygons represented as their centroid
- ...
When points are not polygons
Point data are not only a different geometry than polygons or lines...
... Points can also represent a fundamentally different way to approach spatial analysis
Points unlike polygons
- Rather than exhausting the entire space, points can be events subject to occur anywhere
- The location of the event is part of what we are trying to understand/model
- The interest focuses on characterizing the pattern that the points follow over space
A few examples...
[Source]
[Source]
UFO Sightings (1933-)
Geo-tagged tweets
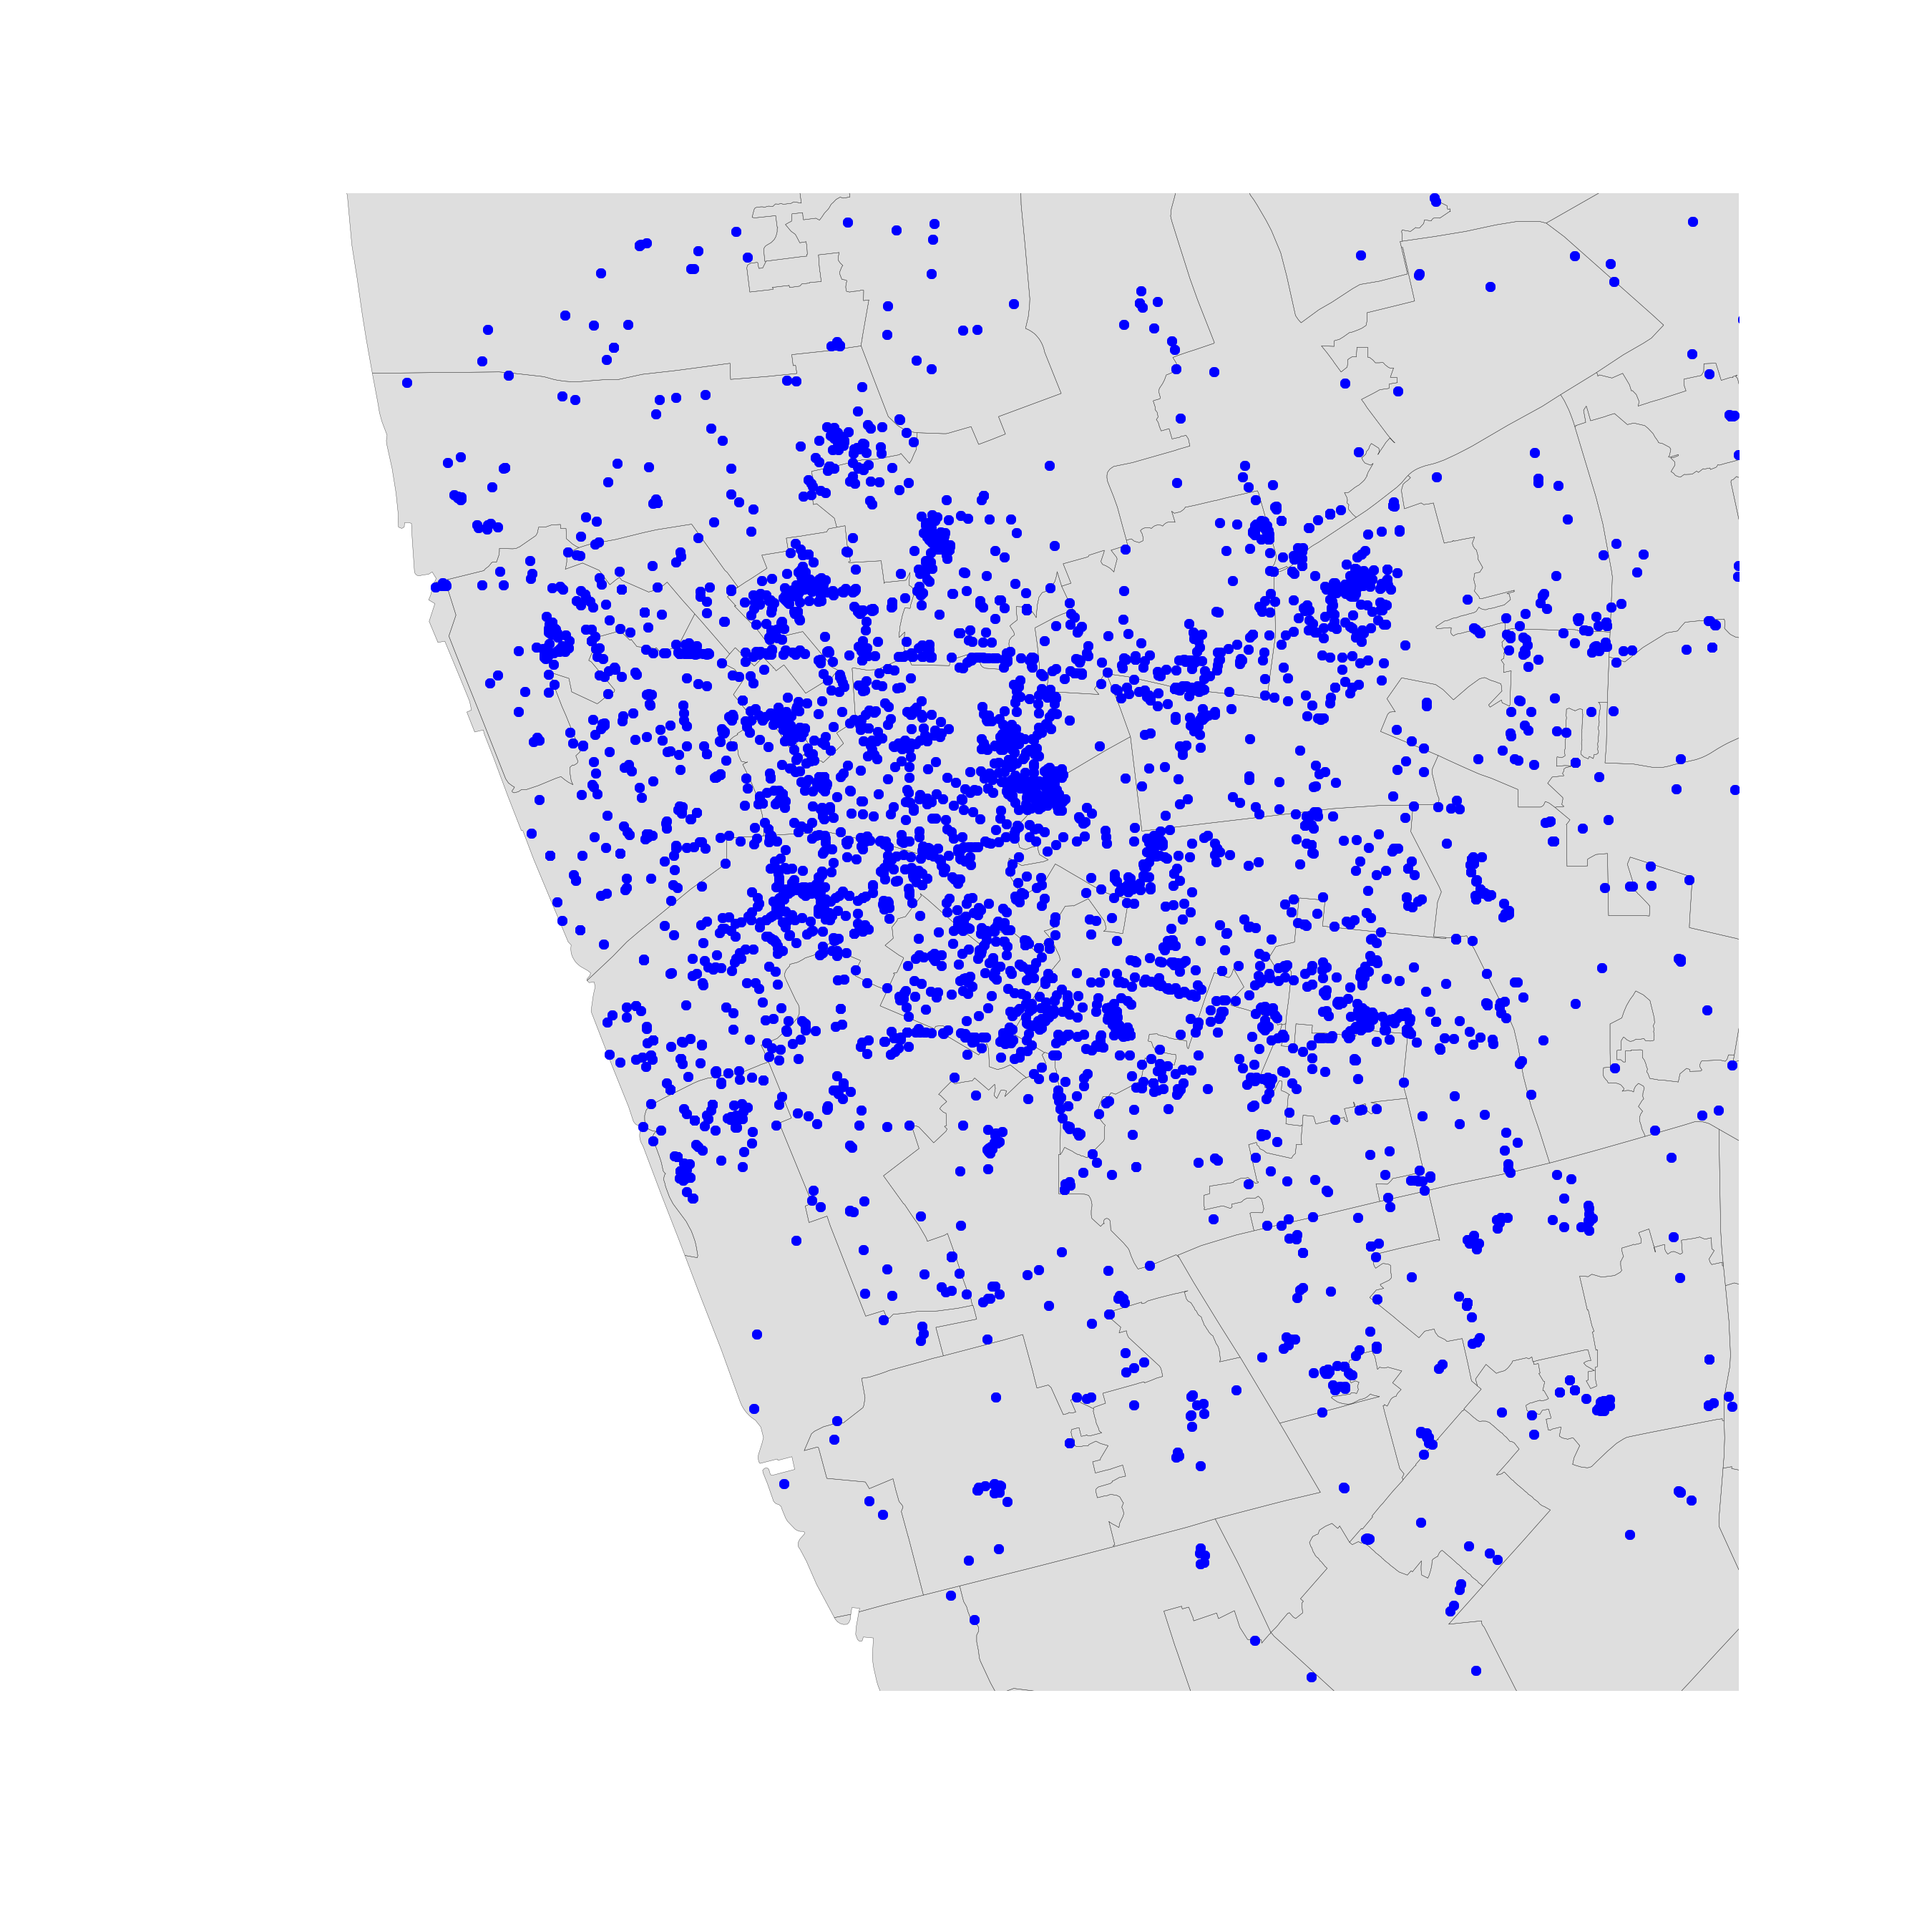
Point patterns
Point patterns
Distribution of points over a portion of space
Assumption is a point can happen anywhere on that space, but only happens in specific locations
- Unmarked: locations only
- Marked: values attached to each point
Point Pattern Analysis
Describe, characterize, and explain point patterns, focusing on their generating process
- Visual exploration
- Clustering properties and clusters
- Statistical modeling of the underlying processes
Visualization of PPs
Visualization of PPs
Two routes (today):
- Aggregate ↔ "Histogram"
- Smooth ↔ KDE
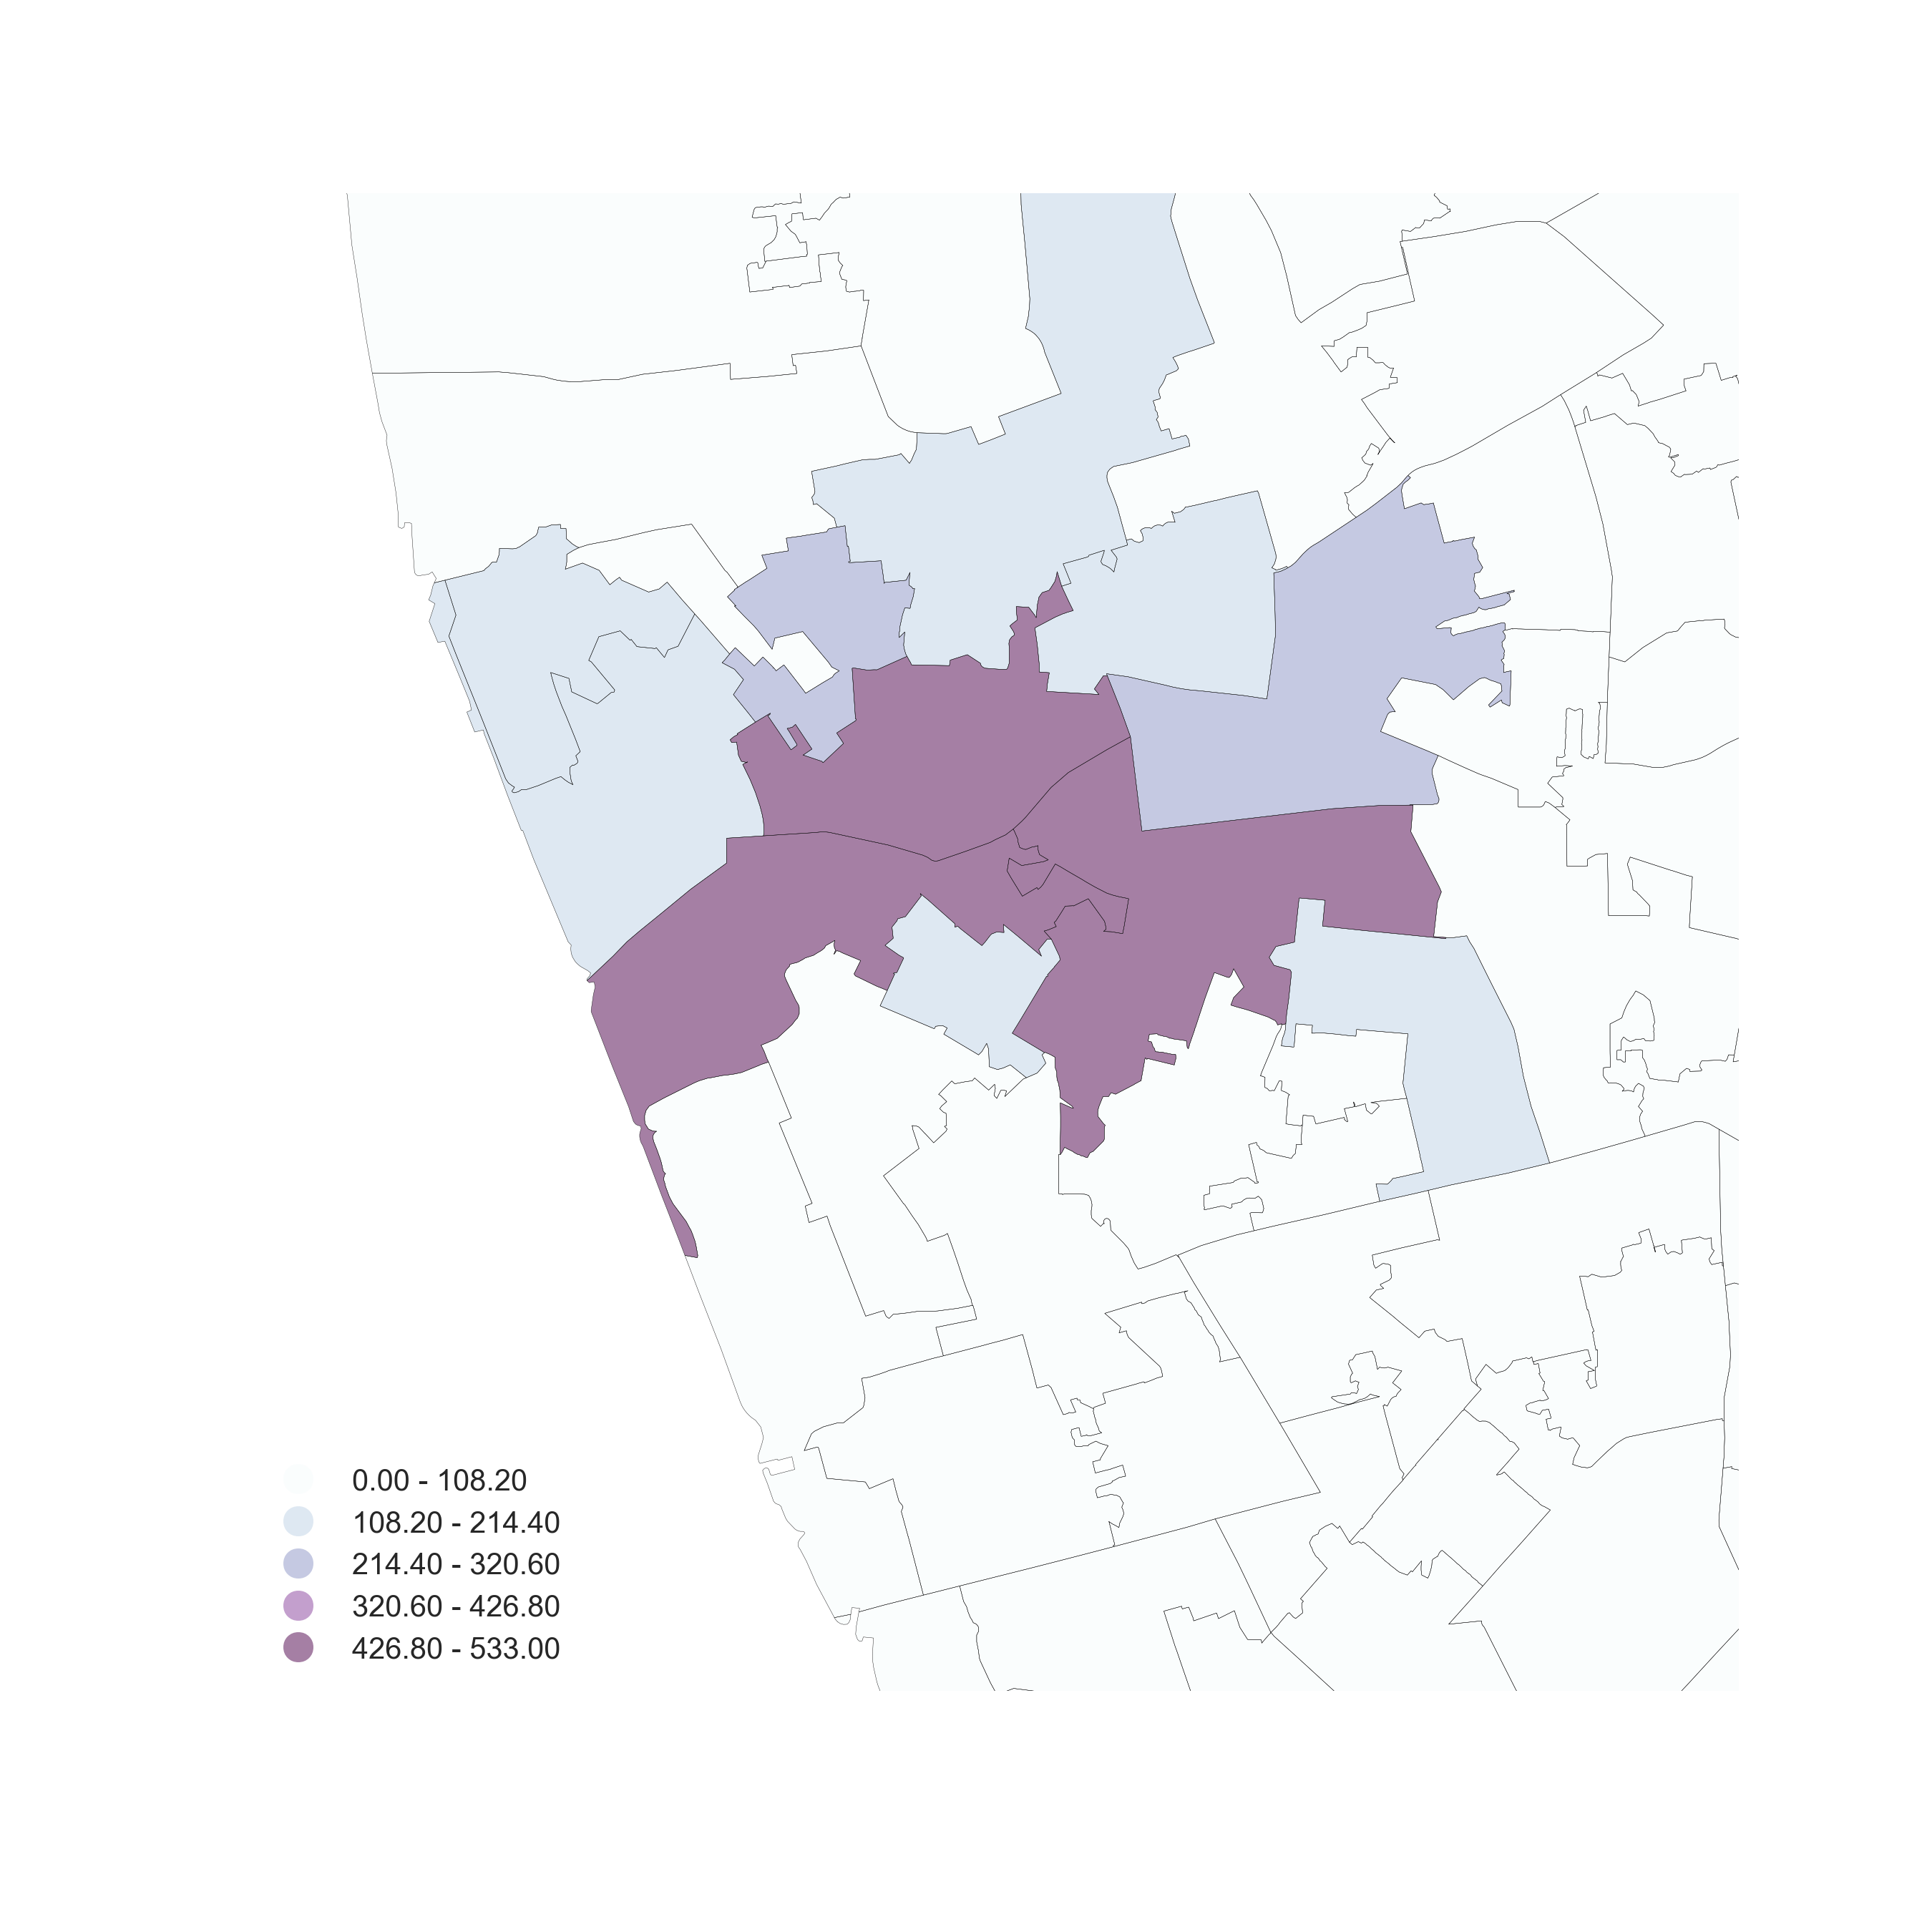
Aggregation
Use polygon boundaries and count points per area
[Insert your skills for choropleth mapping here!!!]
But, the polygons need to "make sense" (their delineation needs to relate to the point generating process)
Hex-binning
If no polygon boundary seems like a good candidate for aggregation...
...draw a hexagonal (or squared) tesselation!!!
Hexagons...
- Are regular
- Exhaust the space (Unlike circles)
- Have many sides (minimize boundary problems)
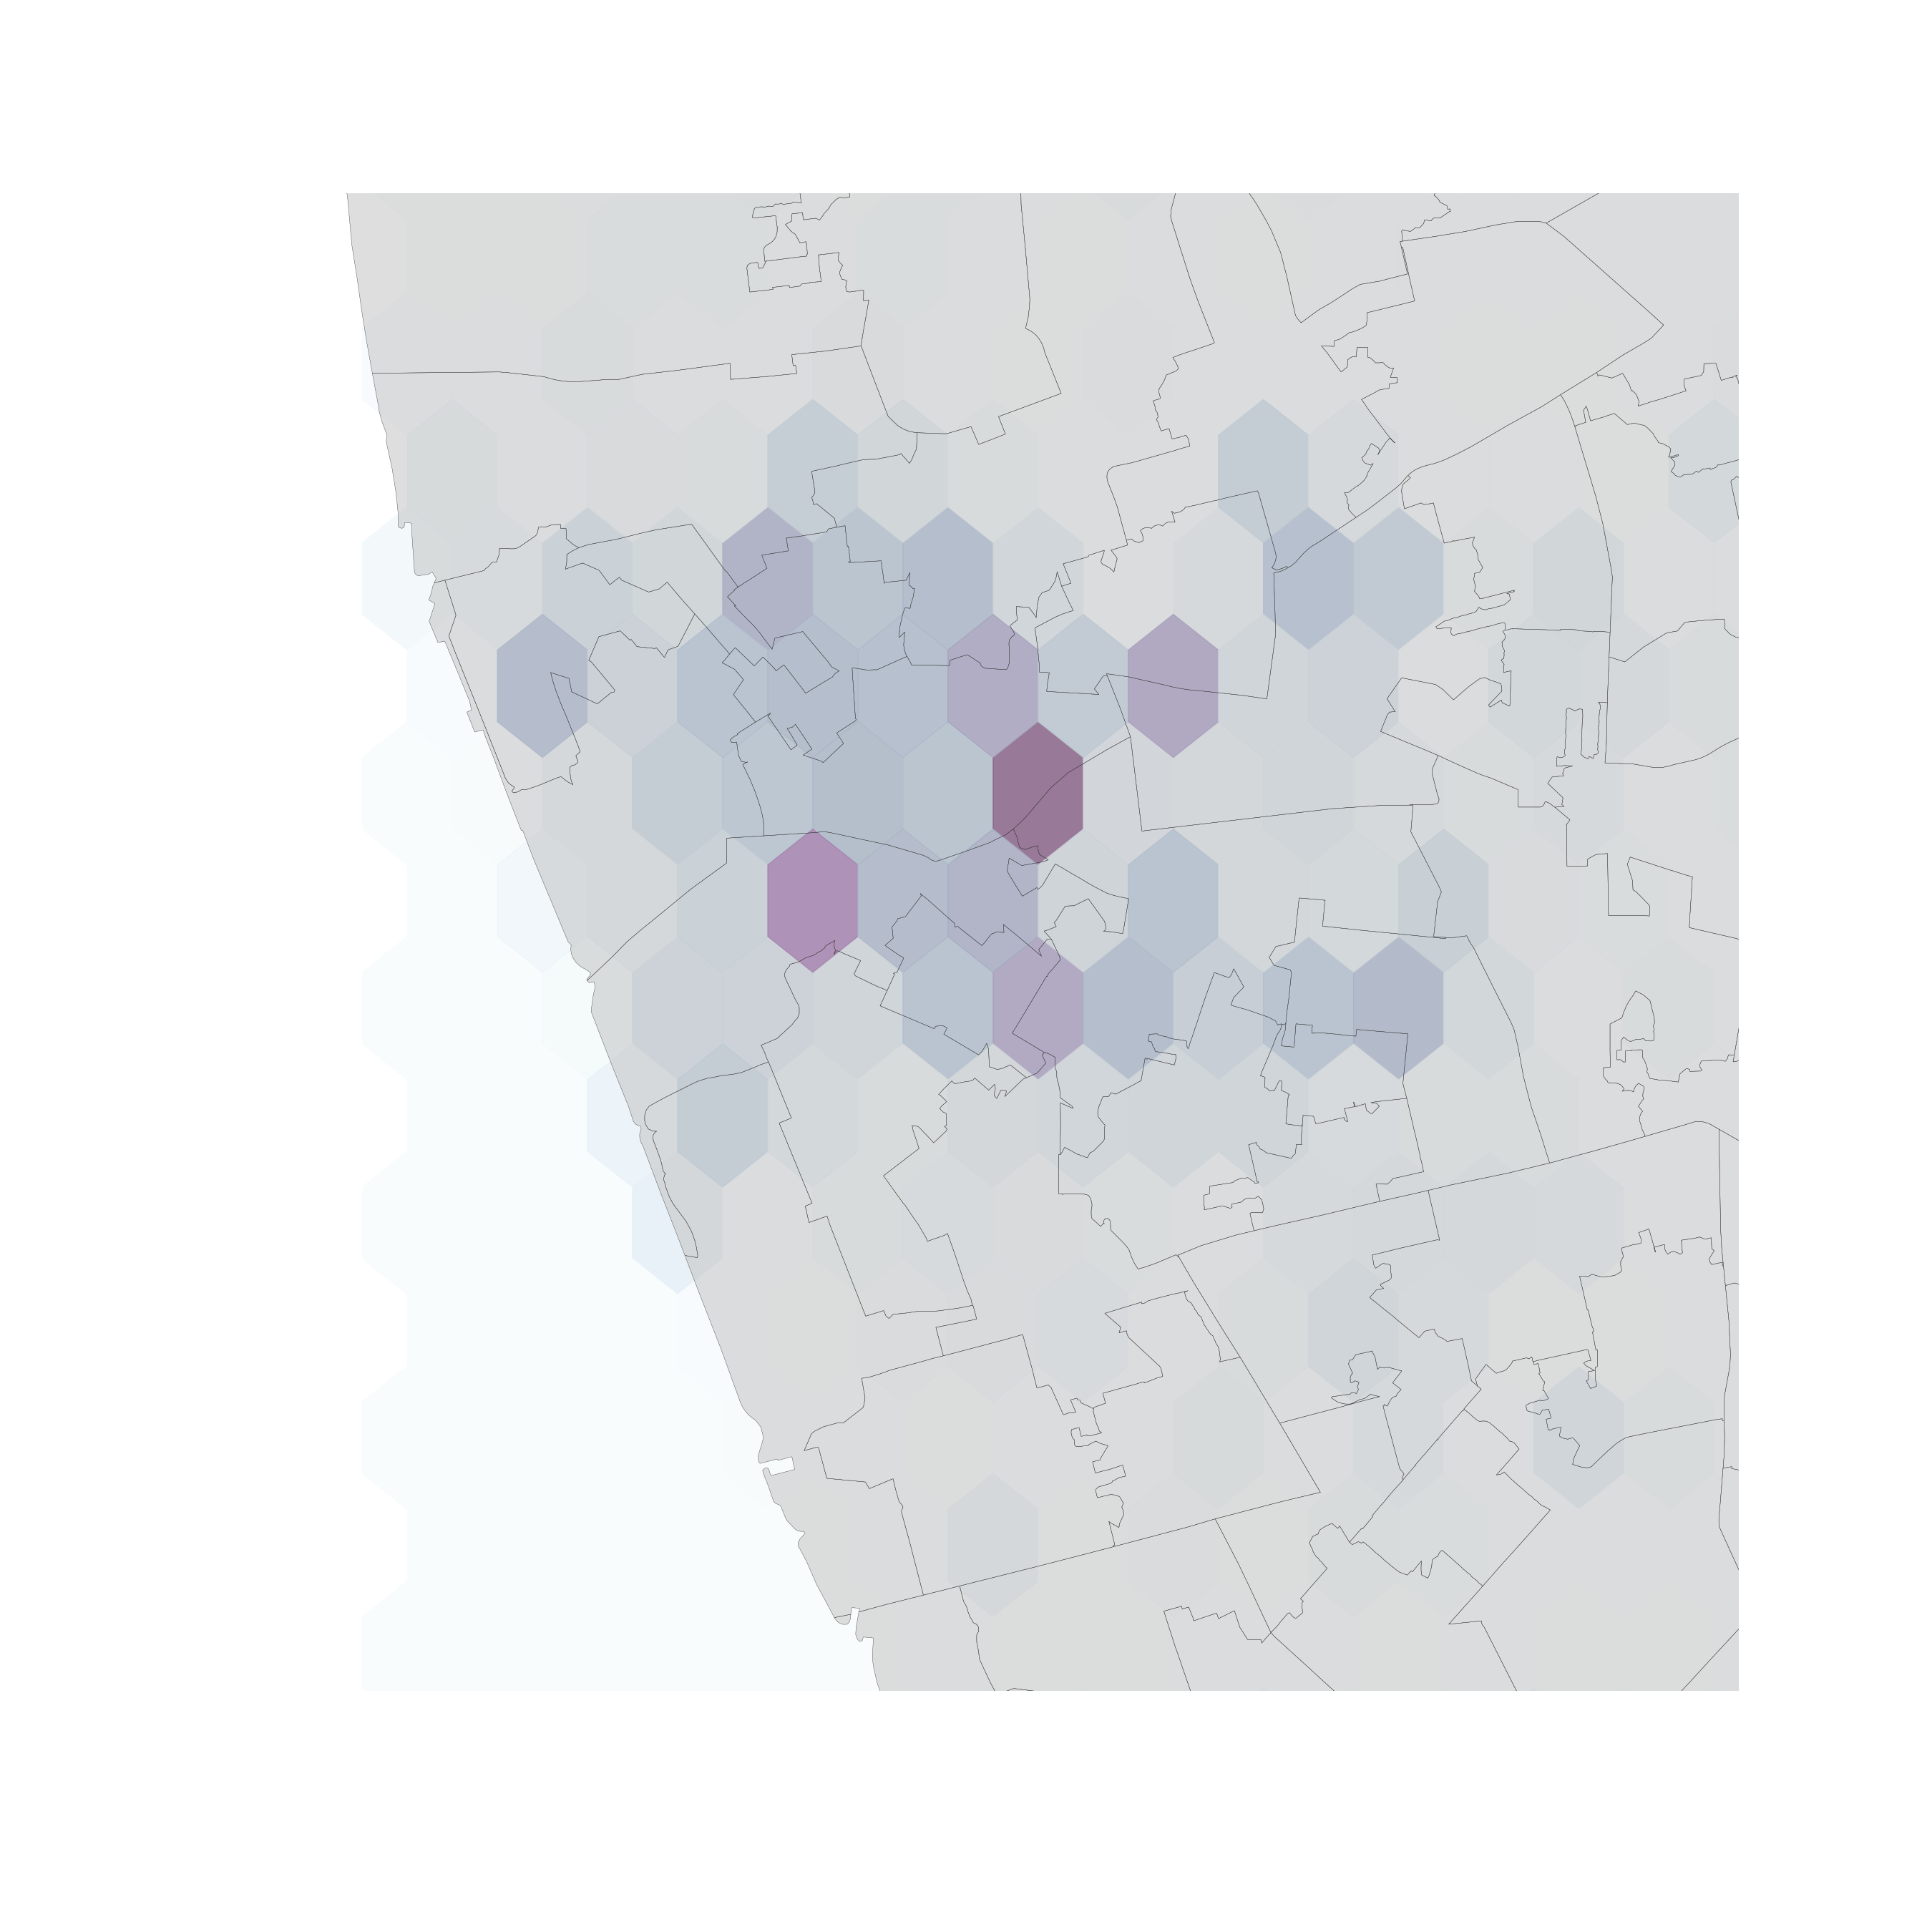
But...
(Arbitrary) aggregation may induce MAUP (see Lecture 4)
Points usually represent events that affect only part of the population and hence are best considered as rates (see Lecture 4)
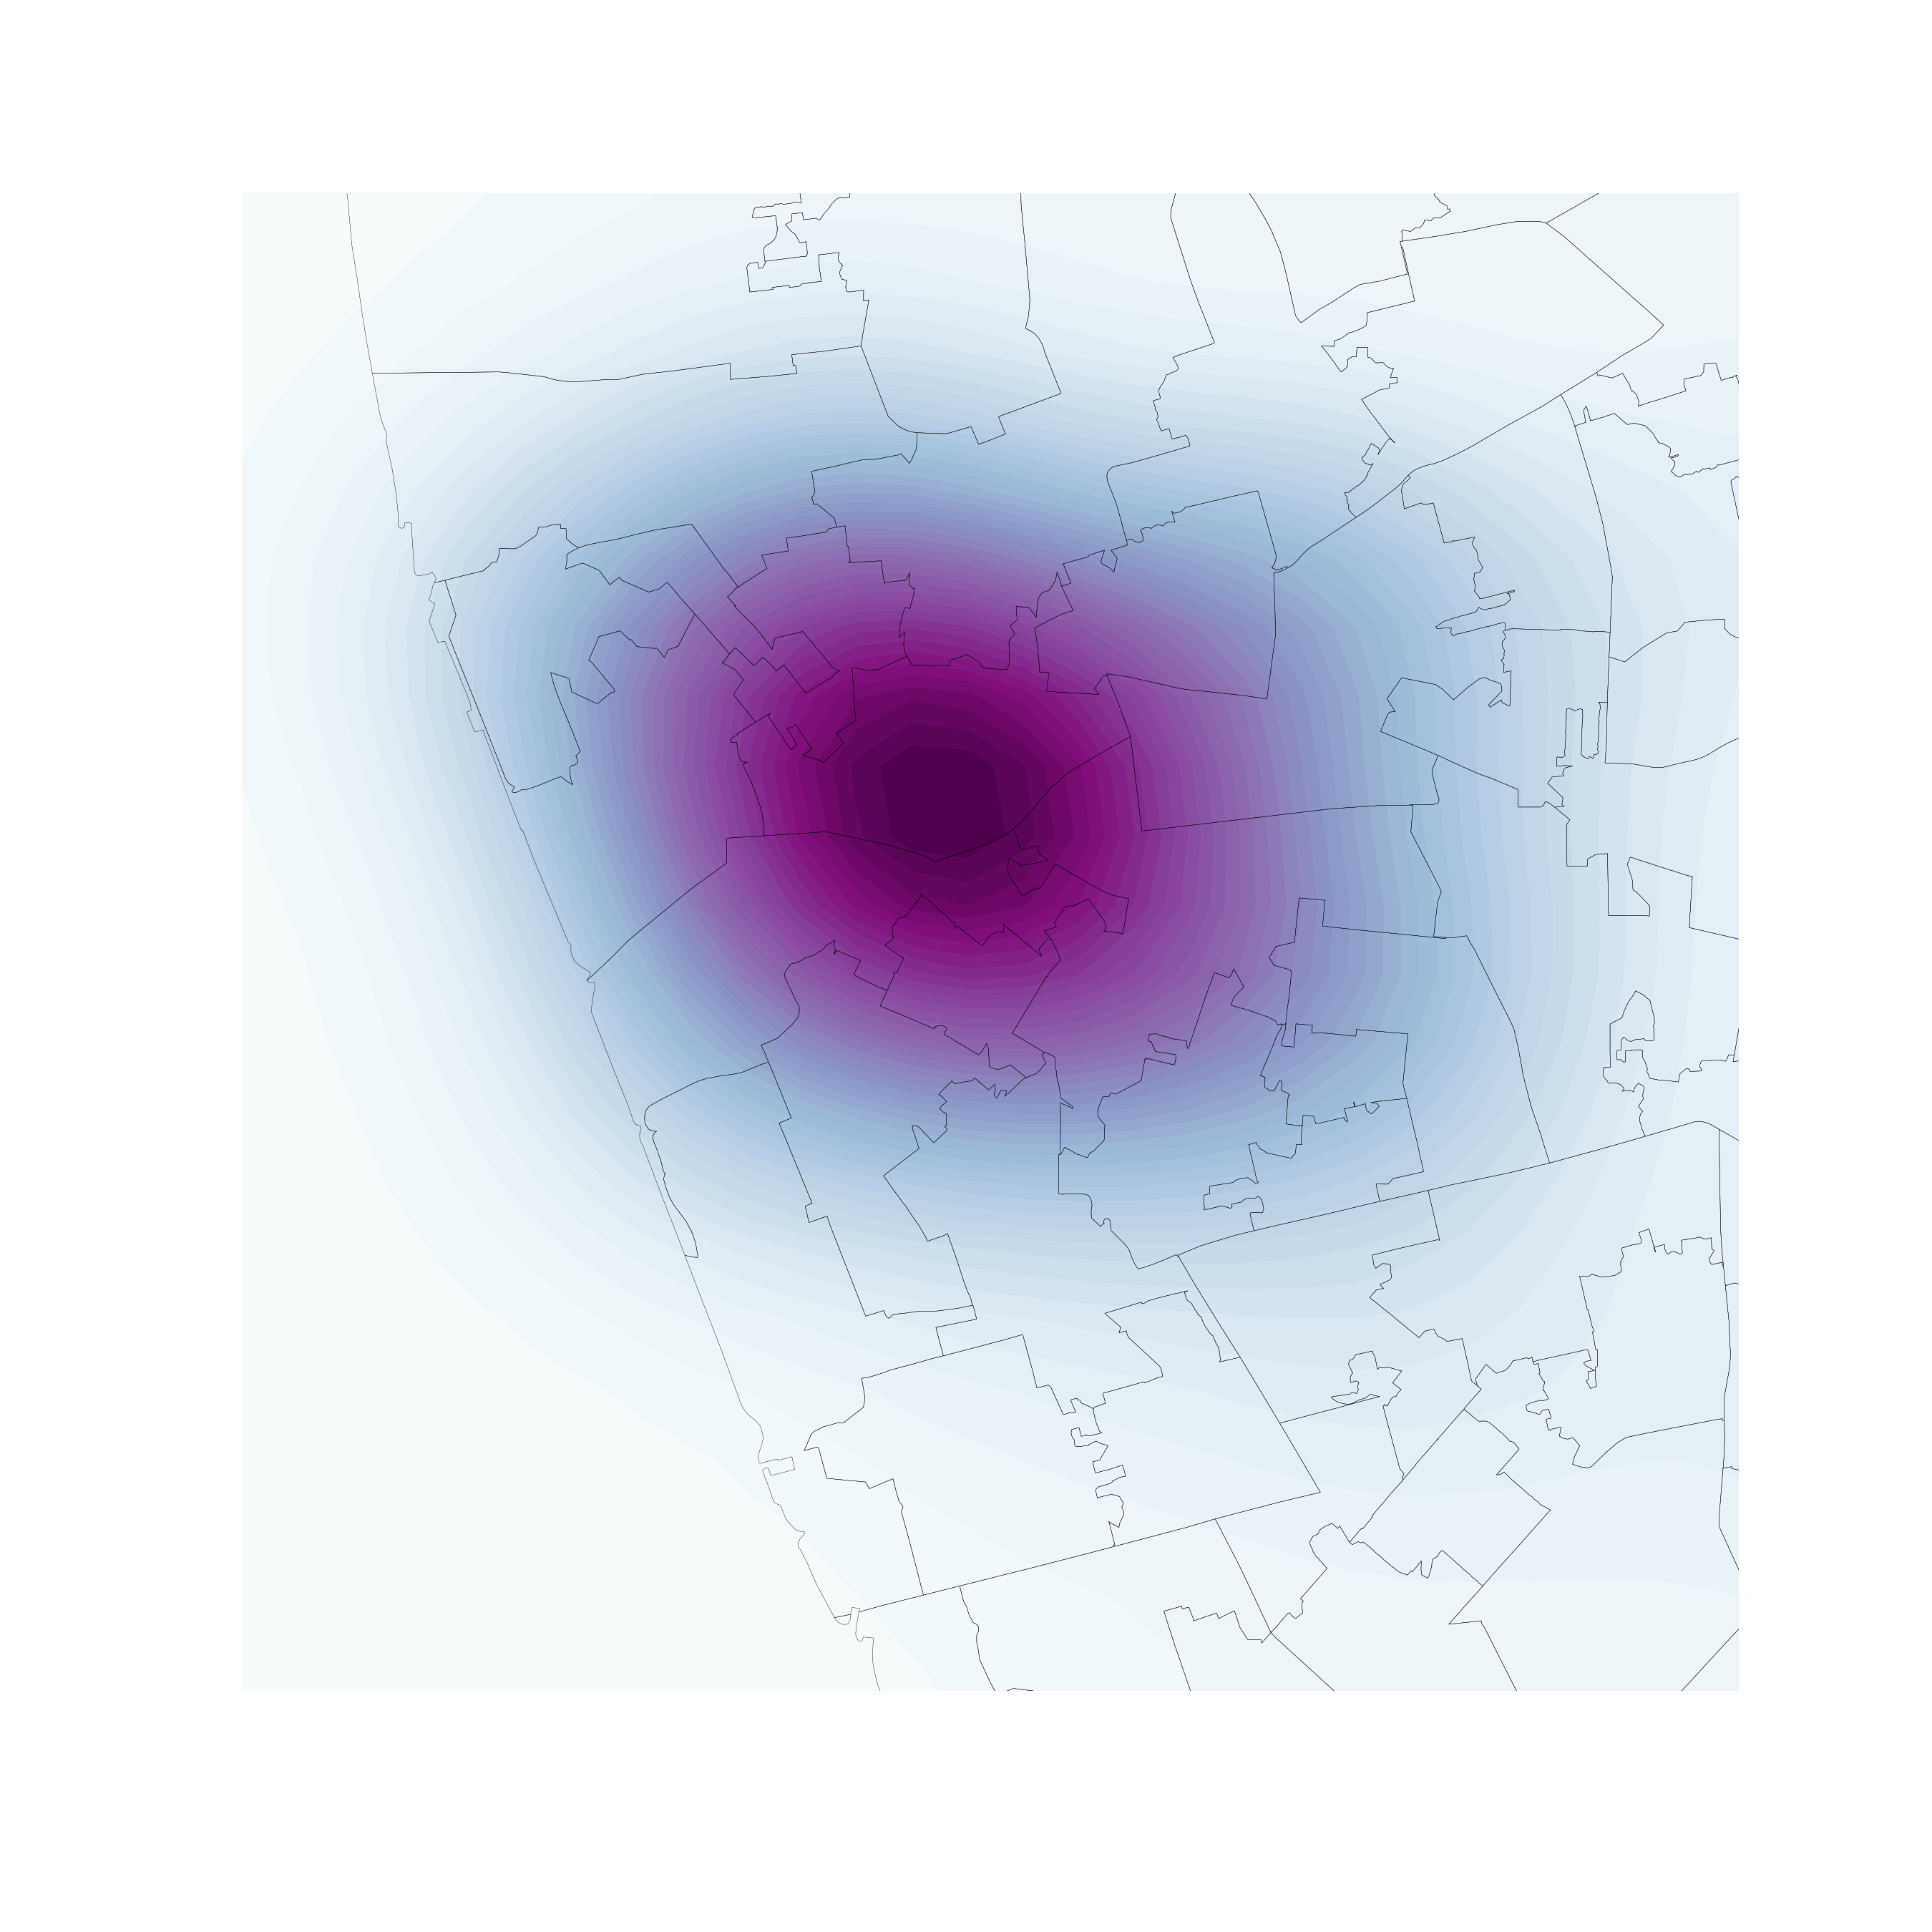
Kernel Density Estimation
Kernel Density Estimation
Estimate the (continuous) observed distribution of a variable
- Probability of finding an observation at a given point
- "Continuous histogram"
- Solves (much of) the MAUP problem, but not the underlying population issue
[Source]
Bivariate (spatial) KDE
Probability of finding observations at a given point in space
- Bivariate version: distribution of pairs of values
- In space: values are coordinates (XY), locations
- Continuous "version" of a choropleth
Finding clusters of PPs
Cluster is a hard to define term
Huge literature spanning spatial analysis, statistics and computer science. Today, we'll look at...
Density
Based
Spatial
Clustering of
Applications with
Noise
DBSCAN
(Additional) Pros:
- Not necessarily spatial
- Very fast to run so → scales relatively well → applicable to large datasets
(Additional) Cons:
- Not based on any probabilistic model (no inference)
- Hard to learn about the underlying process

Geographic Data Science'16 - Lecture 8 by Dani Arribas-Bel is licensed under a Creative Commons Attribution-NonCommercial-ShareAlike 4.0 International License.