Geographic Data Science - Lecture IV
Mapping Data
Dani Arribas-Bel
Today
- Mapping data
- MAUP
- Choropleths
- Definition
- Classes
- Cartograms
- Conditional maps
- Space-Time mapping
Data maps
- Abstraction from the purely geographical map
- Representing numerical values within a spatial context
Mapping data
- A geographical approach to statistical visualization
- The spread of data is considered in its geographical dimension
Before we delve into different types of data maps...
MAUP
Modifiable Areal Unit Problem
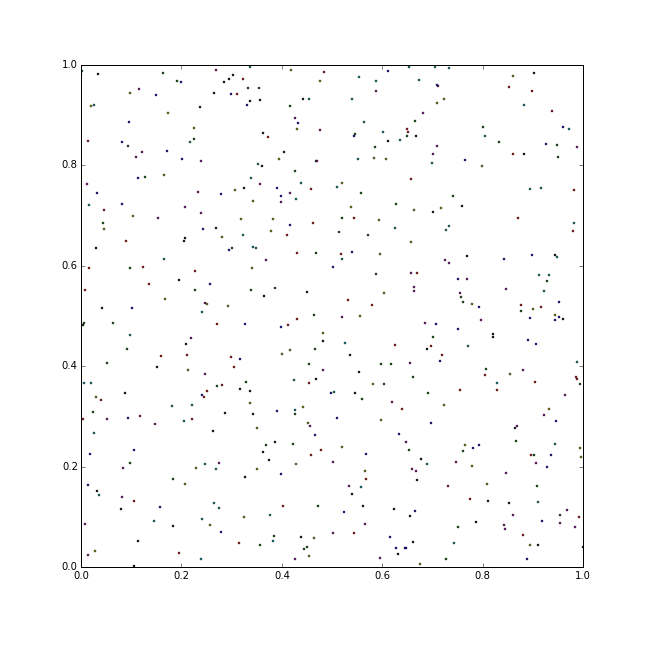
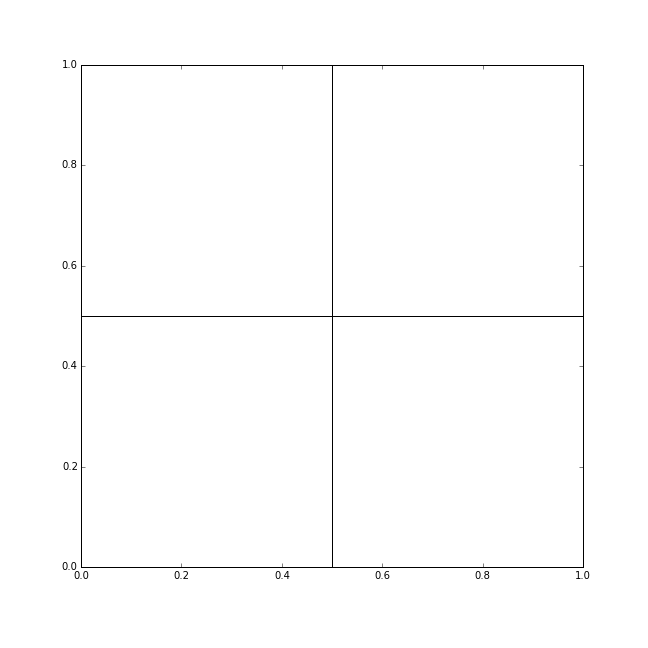
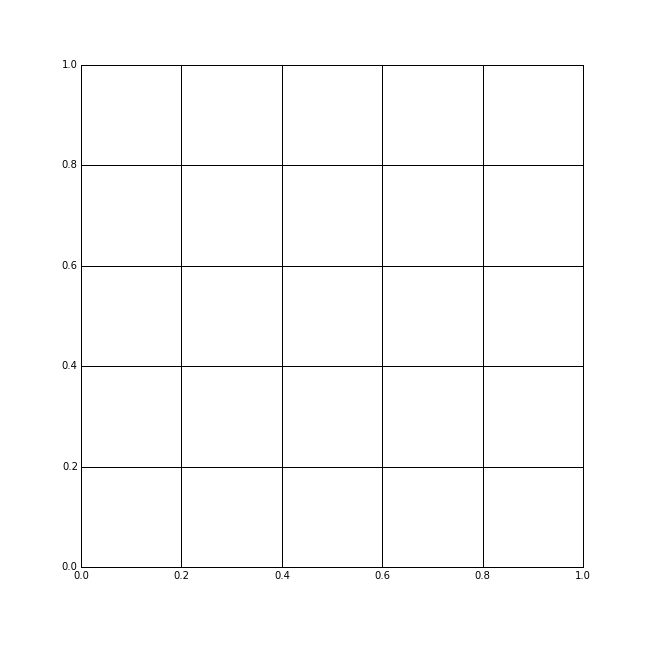
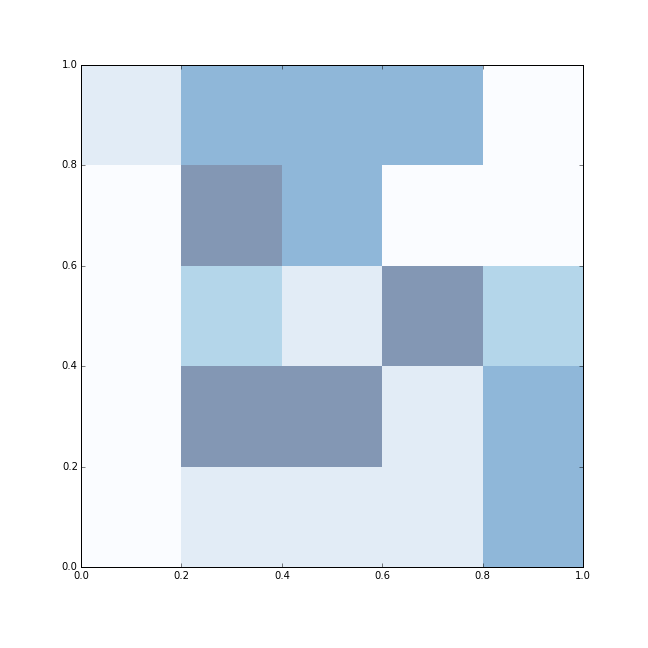
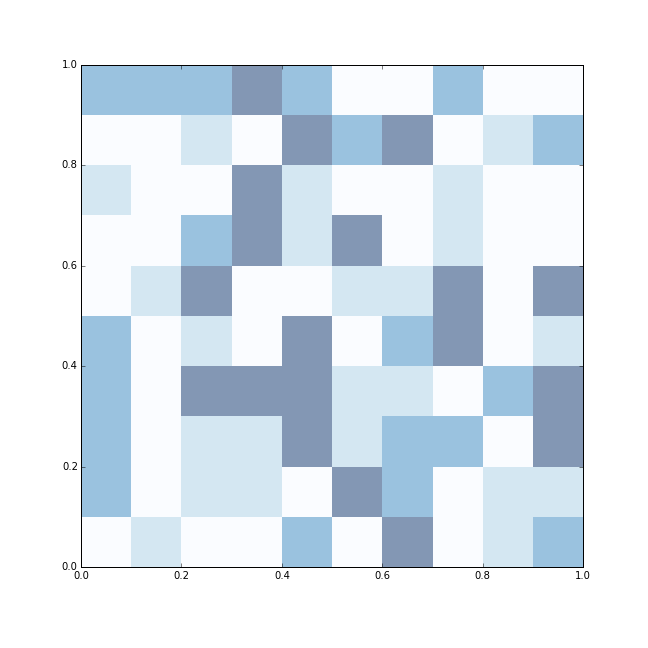
MAUP
Scale and delineation mismatch between:
- Underlying process (e.g. individuals, firms, shops)
- Unit of measurement (e.g. neighborhoods, regions, etc.)
In some cases, it can seriously mislead analysis on aggregated data
Always keep MAUP in mind when exploring aggregated data!!!
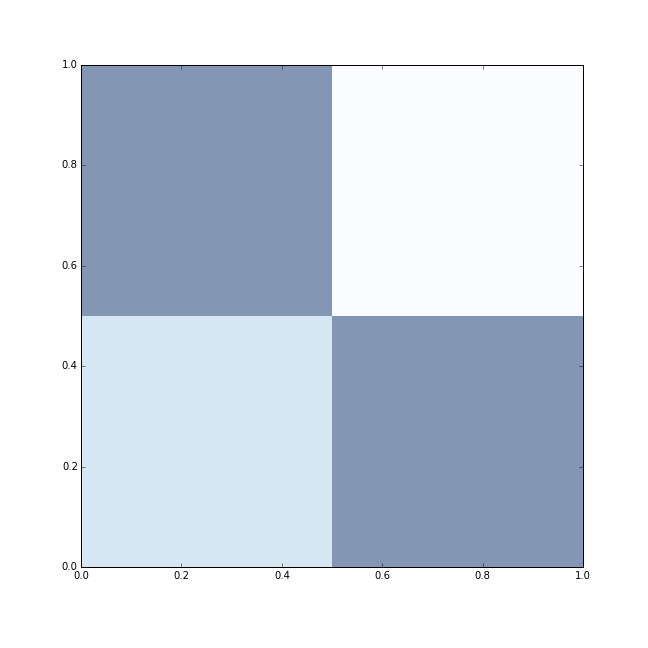
Choropleths
Choropleths
- Counterpart of the histogram
- Values are classified into specific colors: value --> bin
- Information loss as a trade off for simplicity
Classification choices
- Colors --> in alignment with the goal of the map
- Bins --> How many?
- Algorithm:
- Unique values
- Equal interval
- Qua/Quintiles (equal count)
- Fisher-Jenks
- ...
Beware standarization!!!
[Source]
Color schemes
Align with your purpose
- Categories, non-ordered

- Graduated, sequential

- Graduated, divergent

[Source]
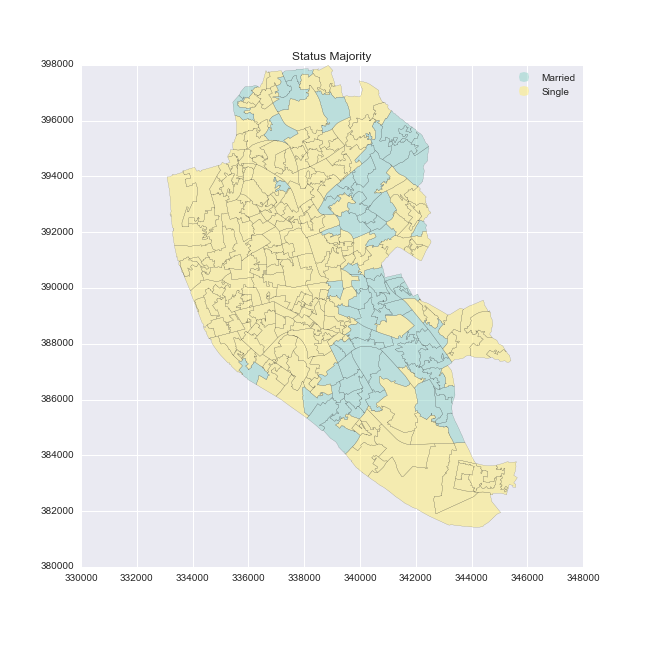
Unique values
- Categorical data
- No gradient (reflect it with the color scheme!!!)
- Examples: Religion, country of origin...
Unique values
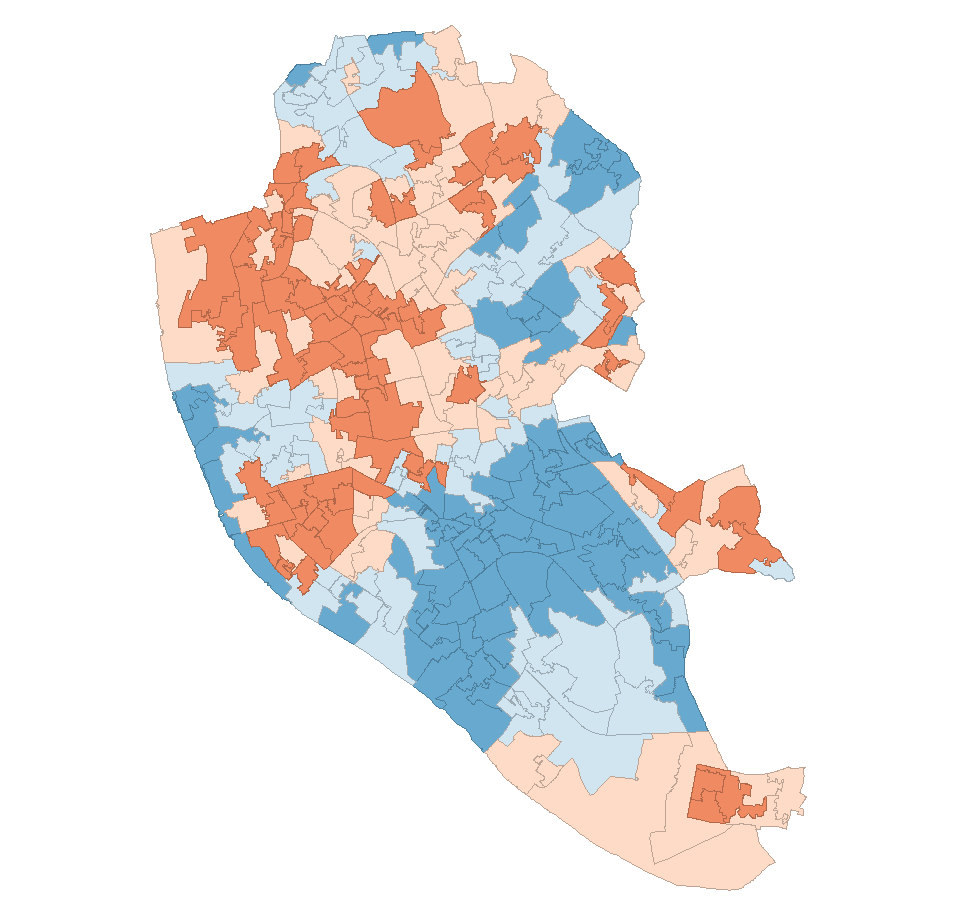
Equal interval
- Take the value span of the data to represent and split it equally
- Splitting happens based on the numerical value
- Gives more weight to outliers if the distribution is skewed
Quantiles
- Regardless of numerical values, split the distribution keeping the same amount of values in each bin
- Splitting based on the rank of the value
- If distribution is skewed, it can put very different values in the same bin
Other
- Fisher-Jenks
- Natural breaks
- Outlier maps: box maps, std. maps...
Tips
Different classification schemes can produce widely different maps as a result of:
- The distribution of the values
- The inherent simplification that a choropleth implies
Best advice is to explore different ones and combine choropleths with other graphical devices like histograms or density plots
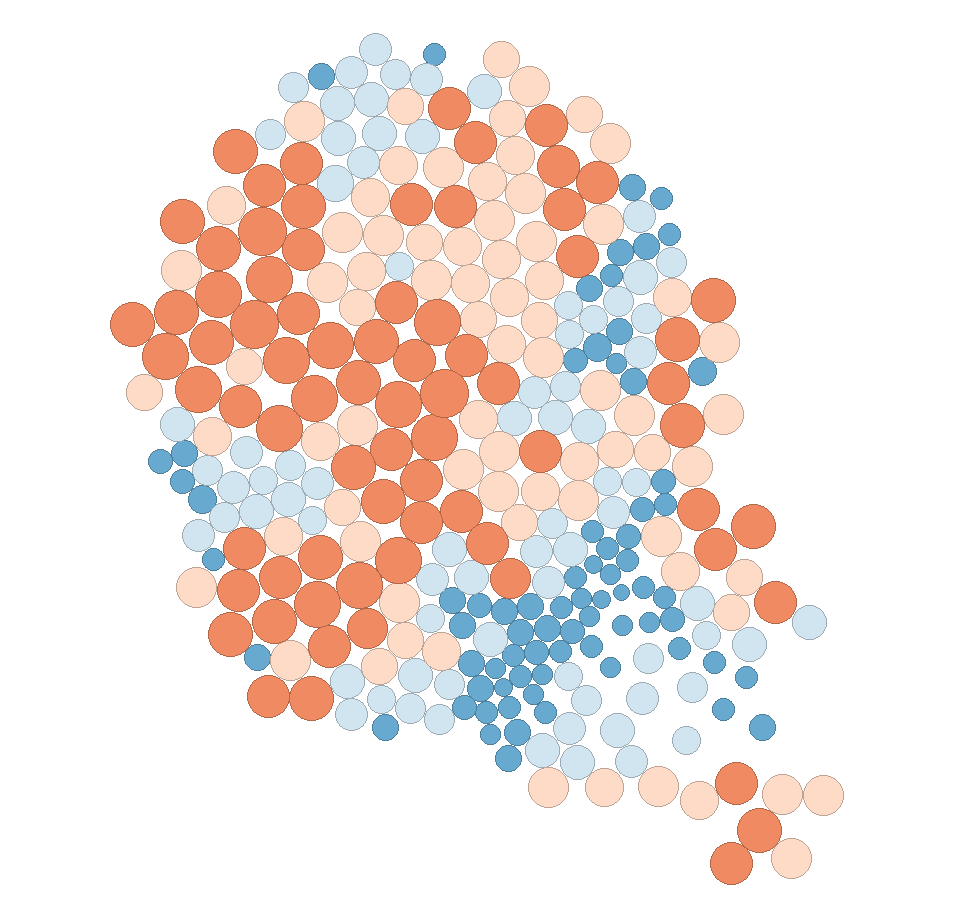
Cartograms
"Data maps where the variable is encoded, not by a color gradient, but by distorting the shape/size of the geographical objects"
- Useful in cases where the natural size/shape induces to wrong interpretation, or obscures the intended representation.
- If not done carefully, it can distort the message in unintended ways
Cartograms
[Source]
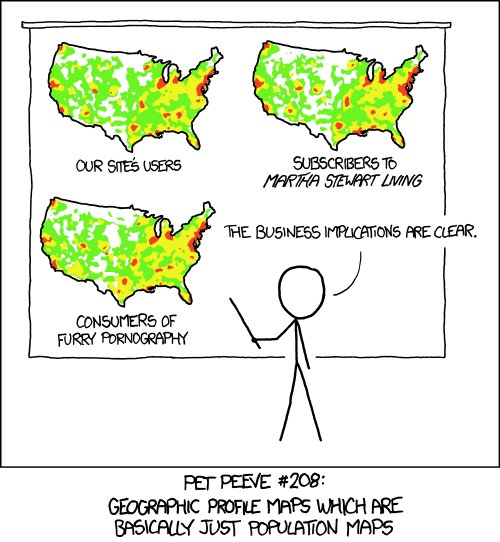
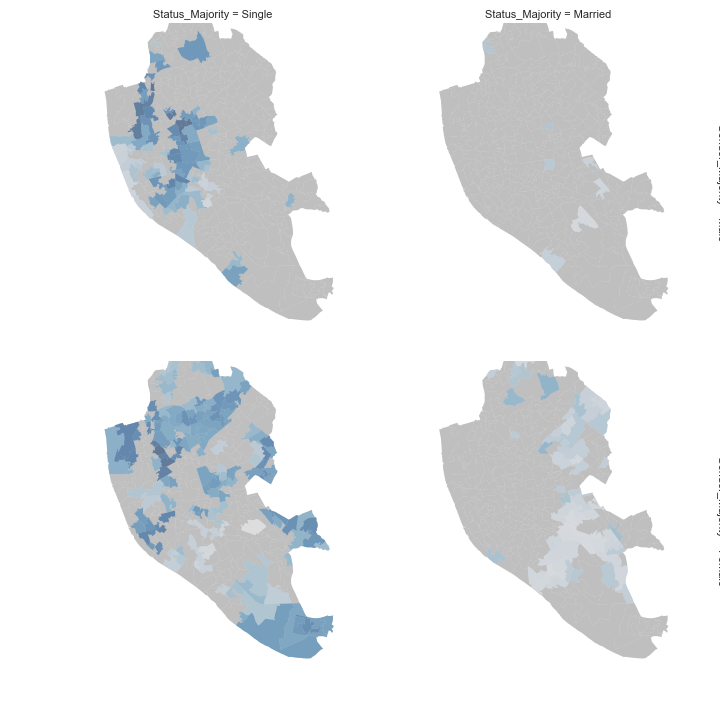
Conditional maps
- If no association, maps should look the same
- But, if the conditioning variables are somewhat related to the outcome we are mapping, the spatial distribution can vary substantially
- Exploration of multivariate relationships
Conditional maps
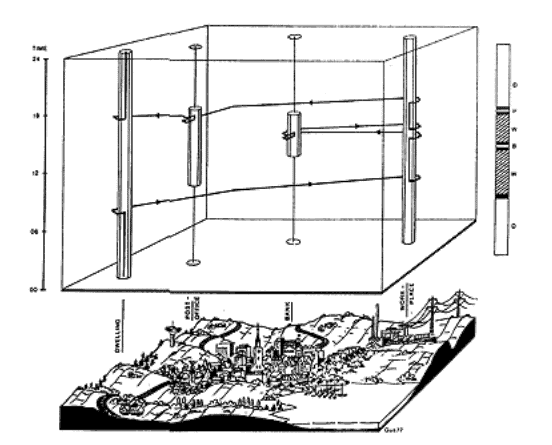
Space-Time mapping
Space-Time mapping
- Bringing time into a spatial 2D context is "tricky" (it's really 3D!)
- Traditionally --> sequence of time periods, 3D plots
- More recently --> animation and interactivity
[Source]
[Source]

Geographic Data Science'16 - Lecture 4 by Dani Arribas-Bel is licensed under a Creative Commons Attribution-NonCommercial-ShareAlike 4.0 International License.